Bundle
 Quick View
Reformed functional skills whole course!
Please note the PNG files are photos that have been used for the previews only. They are not the documents needed to use the resource, they only photos of what is included.
This bundle includes all the topics needed to teach functional skills. All topics for the reformed functional skills qualifications that are included have work books many differentiated to L1 & L2 . Lots of power points and the majority of answers are also included. This really is a bargain.
My exam board is city and guilds. But this would be useful for all exam boards.
Every work book Included is made for the reformed functional skills maths and include calculator and non calculator methods.
Place Value
Rounding and estimation
Multiply by 10,100,1000 and add and subtract including decimals.
Multiplication including decimals
Bidmas
Percentages of amounts, increase and decrease, reverse percentages and compound interest.
Fractions of amounts, simplify fractions mixed fractions, add and subtract fractions.
converting between fractions,decimals and percentages
Ratio and proportion
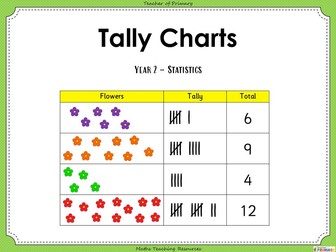
Averages
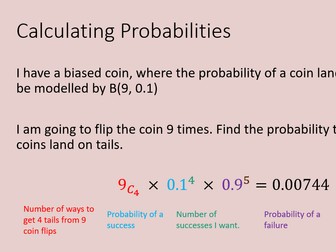
Probability
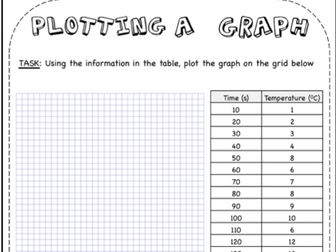
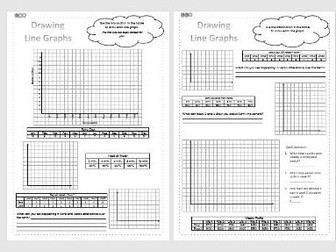
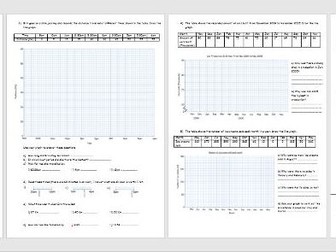
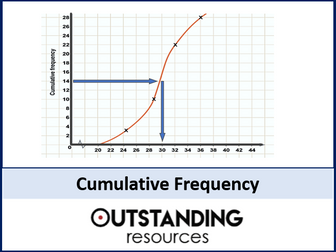
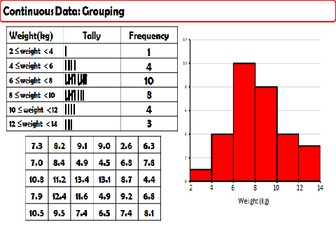
Graphs and charts
Area and perimeter including problems
Substitution into formula
Angles, symmetry and bearing,compass points and coordinates
Metric and imperial conversions
Scale plans, maps, nets ad elevations
L1 non calculator work book
L2 revision workbook with calculator and non calculator questions on every topic.
Please note if you do find typos the workbooks are in word so you can easily amend. I am going through and fixing them as I find them or they are reported to me.
Please see my resources (jonesk5) for the following available for free:
Division workbook
Course outline
Non calculator revision mock
time and timetables