
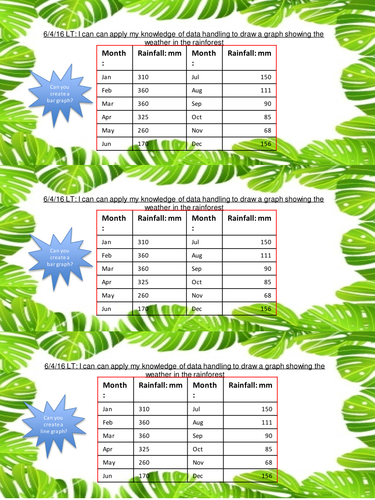
4 way differentiated challenge strips asking children to create either a bar or line graph from data provided about the amount of rain in the Rainforest each month
Red simple bar chart about rain in the Rainforest
Yellow comparative bar chart about rain in the Rainforest and in Birmingham
Green line graph about rain in the Rainforest
Blue comparative line graph about rain in the Rainforest and in Birmingham
Red simple bar chart about rain in the Rainforest
Yellow comparative bar chart about rain in the Rainforest and in Birmingham
Green line graph about rain in the Rainforest
Blue comparative line graph about rain in the Rainforest and in Birmingham
Something went wrong, please try again later.
This resource hasn't been reviewed yet
To ensure quality for our reviews, only customers who have purchased this resource can review it
Report this resourceto let us know if it violates our terms and conditions.
Our customer service team will review your report and will be in touch.
£4.00