
This presentation provides three days of teaching that cover the objectives:
- Draw a line graph and read intermediate points.
- Draw a graph to convert imperial to metric units.
- Use it to find equivalent measures.
It includes starter activities, whole class teaching, group activities, practice sheets and mastery questions. It can be used on a variety of interactive whiteboards.
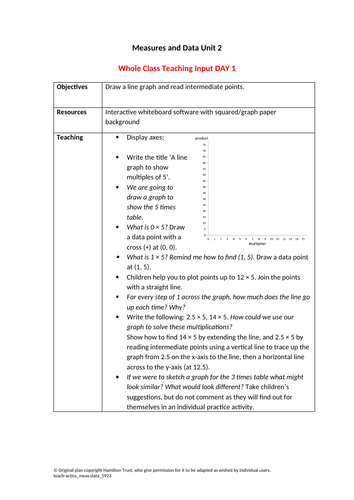
Day 1 Teaching
Draw a vertical axis from 0 to 75 labelled ‘product’ in steps of 5 and a horizontal axis from 0 to 15 labelled ‘multiplier’. Write the title ‘A line graph to show multiples of 5’. Complete the graph, plotting the multiples of 5. How could we use the graph to find 14 × 5? Show how intermediate points on this line can be used to find 2.5 × 5. If we were to sketch a graph for the 3 times table what might look similar? What would look different? Take children’s suggestions.
Day 2 Teaching
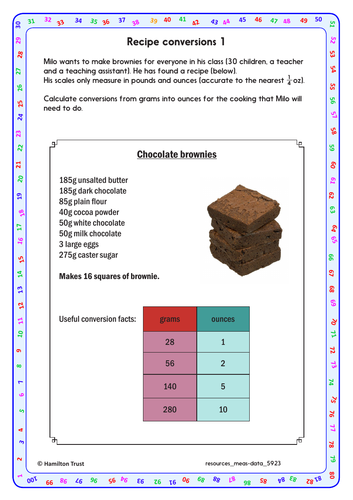
Show a table of approximate conversions from kilograms to ounces and pounds and ounces. Point out that pounds and ounces are often used to give the weight of born baby. Model how to draw a conversion line graph for these measures, with kg on the horizontal axis and ounces on the vertical.
This teaching is part of Hamilton’s Year 5 Measures and Data block. Each Hamilton maths block contains a complete set of planning and resources to teach a term’s worth of objectives for one of the National Curriculum for England’s maths areas.
Get this resource as part of a bundle and save up to 18%
A bundle is a package of resources grouped together to teach a particular topic, or a series of lessons, in one place.
Something went wrong, please try again later.
This resource hasn't been reviewed yet
To ensure quality for our reviews, only customers who have purchased this resource can review it
Report this resourceto let us know if it violates our terms and conditions.
Our customer service team will review your report and will be in touch.
£5.00