

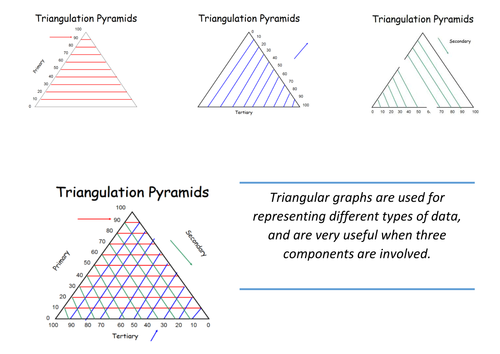

Using data about Birmingham and the Peak District, create triangular graphs to represent employment structure in the UK for comparison. For use with Geography Edexcel B 2016
Something went wrong, please try again later.
This resource hasn't been reviewed yet
To ensure quality for our reviews, only customers who have purchased this resource can review it
Report this resourceto let us know if it violates our terms and conditions.
Our customer service team will review your report and will be in touch.
£1.00