


This Home-Ed resource is a great addition to any home learning journey. These lessons will take your child through the Maths Entry Level 3 which consists of three main components: Handling Data: Tables and Frequency, Interpreting Data and Organising and Representing Data: Charts and Graphs.
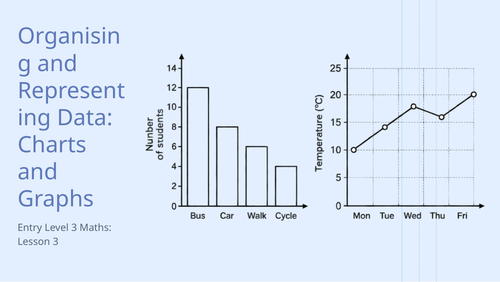
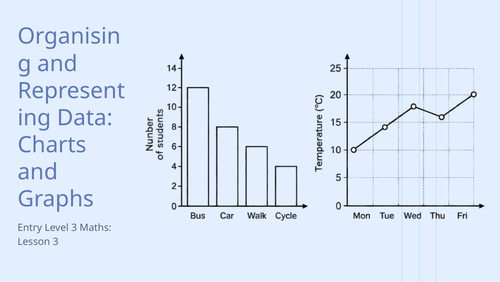
Lesson 3. Organising and Representing Data: Charts and Graphs
-
Recap: Overview of interpreting frequency tables, bar charts, and line graphs.
-
Quiz: Short quiz on interpreting various data formats and making comparisons.
-
Learning Objective: To organise and represent information in appropriate ways including tables, diagrams, simple line graphs and bar charts.
-
Choosing the Right Representation: When to use tables, bar charts, pictograms, and line graphs.
-
Introduction to Bar Chart Creation: Components of a good bar chart (axes, labels, scale).
-
Modelling: Creating a bar chart from a frequency table.
-
Guided Practice: Creating bar charts from given data sets.
-
Introduction to Pictograms: What they are and their key features.
-
Modelling: Creating a pictogram using a key.
-
Guided Practice: Creating pictograms from simple data.
-
Introduction to Line Graph Creation: Components and appropriate use.
-
Modelling: Creating a simple line graph from data showing change over time.
-
Independent Practice: Choosing appropriate representation and creating either a bar chart or line graph.
-
Plenary: Discussing the advantages and disadvantages of different data representations.
Something went wrong, please try again later.
This resource hasn't been reviewed yet
To ensure quality for our reviews, only customers who have purchased this resource can review it
Report this resourceto let us know if it violates our terms and conditions.
Our customer service team will review your report and will be in touch.
£3.50