Entry Level 3 Functional Skills Maths: Handling Information and Data -Lessons and Workbook
Resource Bundle


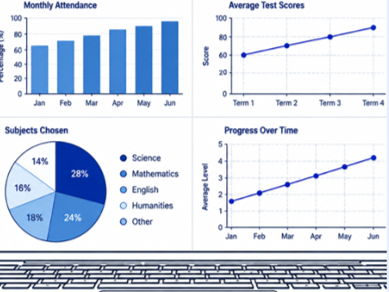

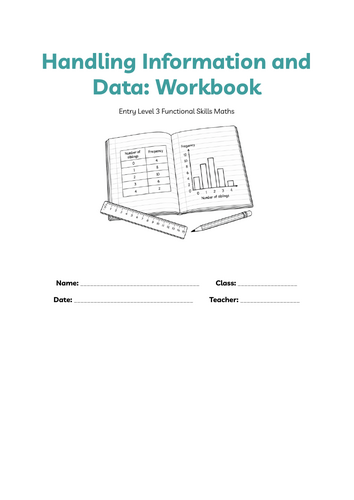
Entry Level 3 Functional Skills Maths - Handling information and data
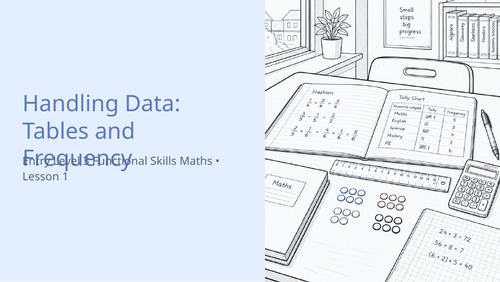
Handling Data: Tables and Frequency
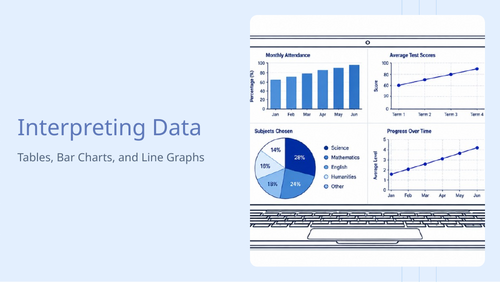
Interpreting Data
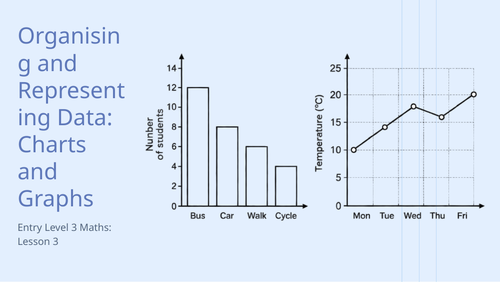
Organising and Representing Data: Charts and Graphs
Statistics
Describe, interpret and compare observed distributions of a single variable through: appropriate graphical representation involving discrete, continuous and grouped data; and appropriate measures of central tendency (mean, mode, median) and spread (range, consideration of outliers)
Construct and interpret appropriate tables, charts, and diagrams, including frequency tables, bar charts, pie charts, and pictograms for categorical data, and vertical line (or bar) charts for ungrouped and grouped numerical data
Something went wrong, please try again later.
This resource hasn't been reviewed yet
To ensure quality for our reviews, only customers who have purchased this resource can review it
Report this resourceto let us know if it violates our terms and conditions.
Our customer service team will review your report and will be in touch.