
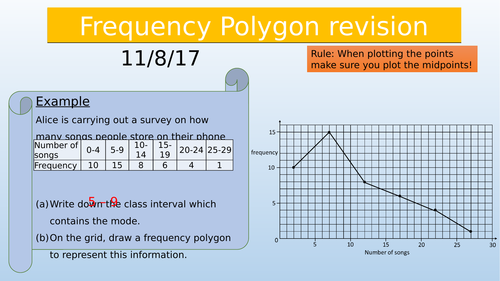
This revision lesson reminds students how to draw both Frequency polygons and cumulative frequency curves. This is done through both worked examples and a few for them to have a go at before checking answers at the board.
The lesson also reminds students how the median and Interquartile range are found from the cumulative frequency curve.
The lesson also reminds students how the median and Interquartile range are found from the cumulative frequency curve.
Get this resource as part of a bundle and save up to 71%
A bundle is a package of resources grouped together to teach a particular topic, or a series of lessons, in one place.
Something went wrong, please try again later.
Report this resourceto let us know if it violates our terms and conditions.
Our customer service team will review your report and will be in touch.
£2.30