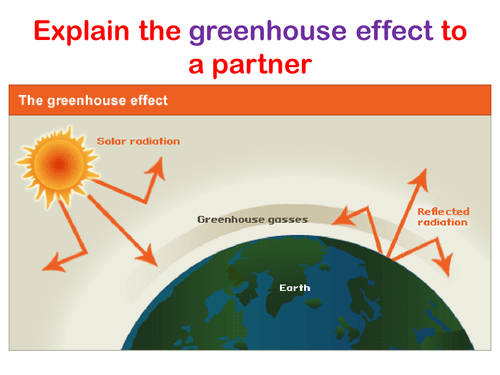

In this lesson students will learn about the causes of the enhance greenhouse effect. Students start the lesson with a gap fill activity explaining the greenhouse effect. Next they are introduced to the composition of the atmosphere and which gases are greenhouse gases before defining the enhanced greenhouse effect. Then the students will complete flow charts about how methane and carbon dioxide is produced, these will be enhanced by selecting factual information from a sheet to apply to the flow charts. After that students will practice their graphical skills deciding whether a data set is discrete or continuous and selecting a graph to draw, before plotting a pie chart accurately using a protractor. Finally, there is a multiple choice examination question to finish the lesson. All resources are provided at the end of the PowerPoint.
Something went wrong, please try again later.
This resource hasn't been reviewed yet
To ensure quality for our reviews, only customers who have purchased this resource can review it
Report this resourceto let us know if it violates our terms and conditions.
Our customer service team will review your report and will be in touch.