
A super lesson that explores the ways to present, analyse & explain data.
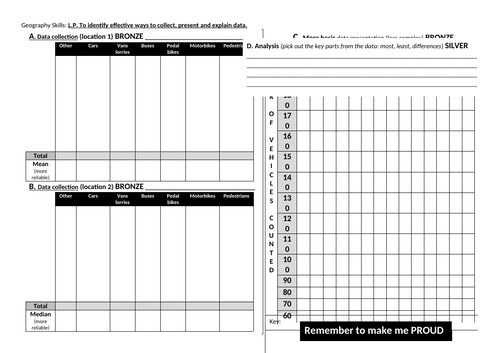
I got students to create a traffic tally on a local road, whilst keeping then in the school grounds. I then did a comparison on the city of Delhi (found a clip on youtube).
Students then created a bar graph & then moved on to completing a more complex data presentation.
Links well to much of the new 1-9 specification and was used as part of the KS3 SOW.
Something went wrong, please try again later.
This resource hasn't been reviewed yet
To ensure quality for our reviews, only customers who have purchased this resource can review it
Report this resourceto let us know if it violates our terms and conditions.
Our customer service team will review your report and will be in touch.
£2.00