
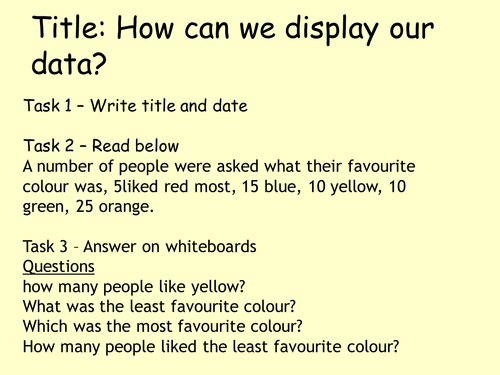
This lesson encourages students to start thinking about continuous and discontinuous data with lots of concrete examples. They plot a human bar graph of favourite colours and then carry out a small experiment investigating how the volume of vinegar added to baking soda alters the amount of foam produced. This easily lasts a double lesson (100minutes) and is a really fun way to get students engaged with graphs.
Save yourself some time and grab a bargain.
Save yourself some time and grab a bargain.
Something went wrong, please try again later.
This resource hasn't been reviewed yet
To ensure quality for our reviews, only customers who have purchased this resource can review it
Report this resourceto let us know if it violates our terms and conditions.
Our customer service team will review your report and will be in touch.
£2.00