
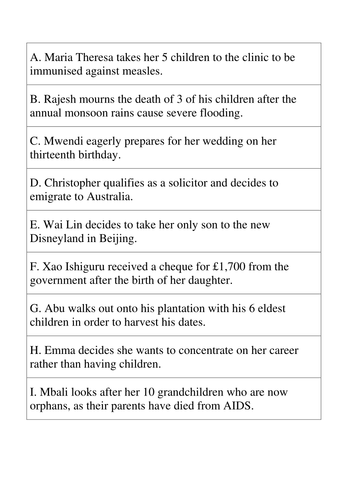

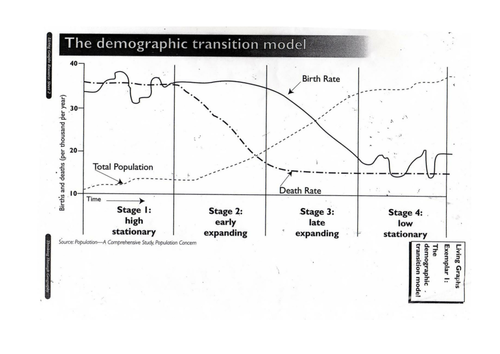
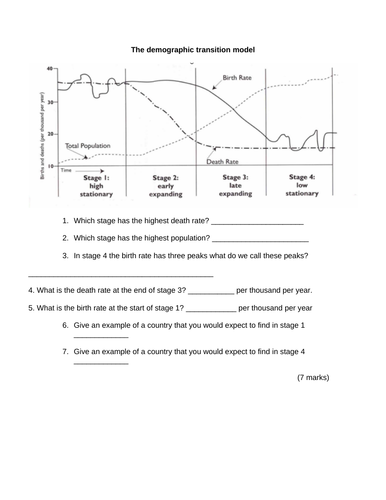
There are enough resources here to lat 2 lesson, alternatively you can pick and choose the activities that you find most useful. In this lesson students will be introduced to the demographic transition model. They will be shown a video clip that outlines the characteristics of each stage and the reasons for birth rates and death rates. Pupils will then undertake a living graph activity with temporal statements relating to the UK. Students will write paragraphs explaining where they located the statements. There are sentence starters to help students to structure their answers and a mark scheme which can be adapted. There is also a spatial living graph set of statements, which relate to different countries around the world now. A DTM quiz is also included and an examination question.
Something went wrong, please try again later.
This resource hasn't been reviewed yet
To ensure quality for our reviews, only customers who have purchased this resource can review it
Report this resourceto let us know if it violates our terms and conditions.
Our customer service team will review your report and will be in touch.
£2.00