
These activities put statistics in a real life context.
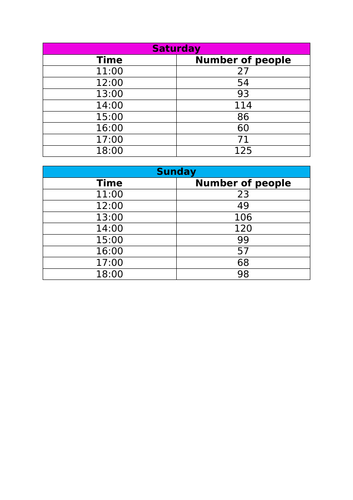
There is a table of data showing how many customers visited Frankie and Benny’s on Saturday and Sunday.
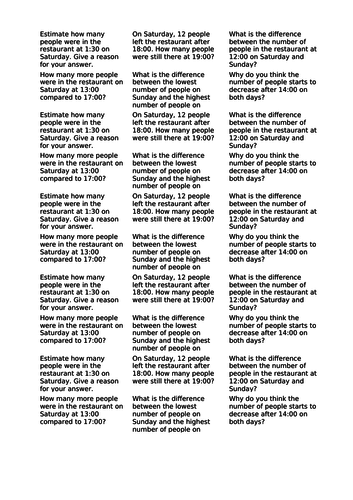
This data can be used to create a line graph. Higher ability children could create one with two lines, one for each day. As an extension, there are questions (small sticker format) to answer about the data.
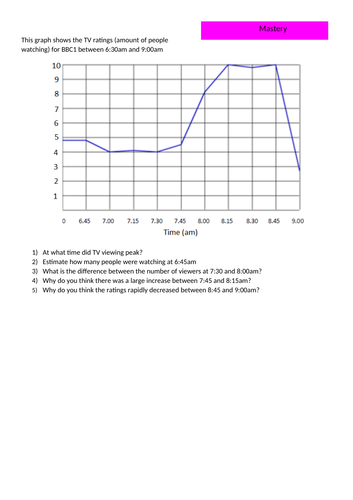
For children who progress quickly there is also a separate mastery activity, answering questions using a line graph.
Something went wrong, please try again later.
This resource hasn't been reviewed yet
To ensure quality for our reviews, only customers who have purchased this resource can review it
Report this resourceto let us know if it violates our terms and conditions.
Our customer service team will review your report and will be in touch.
£1.50