

This presentation provides four days of teaching that cover the objectives:
- Construct and interpret pie charts
- Find the mean of a data set
It includes starter activities, whole class teaching, group activities, practice sheets and mastery questions. It can be used on a variety of interactive whiteboards.
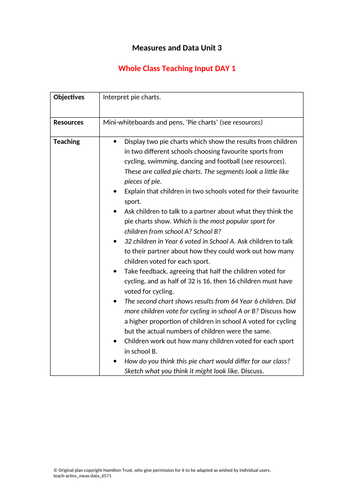
Day 1 Teaching
Show 2 pie charts with results of favourite sports surveys. Explain what a pie chart is. Discuss how we interpret these, asking questions, e.g., Which is the most popular sport for children from school A? School B?
Day 2 Teaching
Show a table of how difficult 12 children find each times-table. Discuss how to show this in a pie chart. We need to work out the size of each segment by finding the number of children as a fraction of the whole.
Day 3 Teaching
Ask children what ‘average’ means. There are different ways of finding an average. Work together to find the mean length (letter count) of a set of six names. Explore the effect of adding another name to the set (more letters than the current mean), using a calculator to find the answer.
Day 4 Teaching
Show children a table of numbers of texts (see resources) sent on one typical day by children in Y7. Children find the average. Compare with numbers of texts send by children in Y10.
This teaching is part of Hamilton’s Year 6 Measures and Data block. Each Hamilton maths block contains a complete set of planning and resources to teach a term’s worth of objectives for one of the National Curriculum for England’s maths areas.
Get this resource as part of a bundle and save up to 18%
A bundle is a package of resources grouped together to teach a particular topic, or a series of lessons, in one place.
Something went wrong, please try again later.
This resource hasn't been reviewed yet
To ensure quality for our reviews, only customers who have purchased this resource can review it
Report this resourceto let us know if it violates our terms and conditions.
Our customer service team will review your report and will be in touch.
£5.00