


This is the full resource pack for an assessment for KS3, or low level KS4 students who are studying chemical reactions, specifically the reaction between metals and acids, this assessment investigates the link between the size of magnesium added to an acid and the volume of hydrogen gas produced.
This resource pack comes with several parts;
1. PowerPoint presentation to introduce the task.
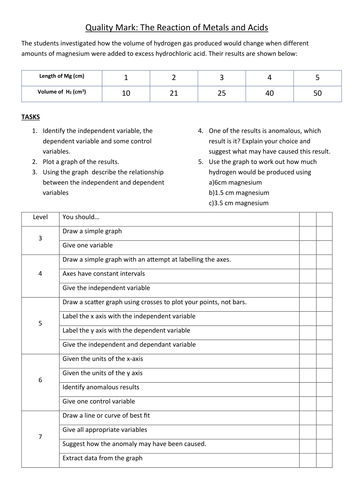
2. Word document printout for the students to stick in their books with just the task on, there is also a word document with both the task and level ladder combined onto one sheet to reduce printing.
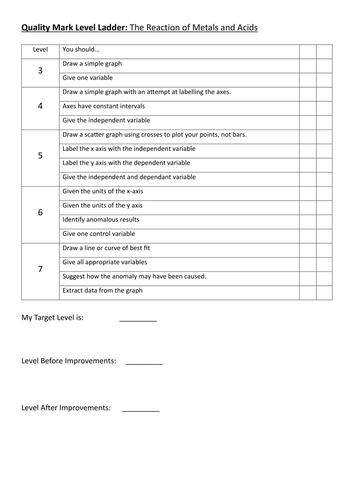
3. Word document printout with a level ladder on so that the students can self/peer assess the work, there is also a column so the teacher can tick off the achieved criteria.
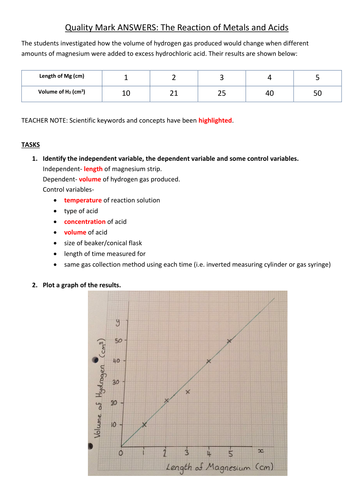
4. Word document containing a mark scheme, including exemplar answers and copies of the graph work.
5. Excel spreadsheet that can be used to automatically generate extended written feedback including improvement strategies for the teacher to give the students.
A guide on how to use this resource can be freely accessed at…
https://www.tes.com/teaching-resource/the-automarker-11191496
6. Word document printout writing frame to assist students who may benefit from additional help with this task.
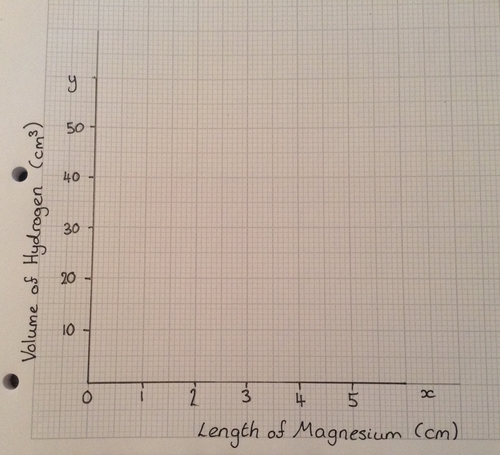
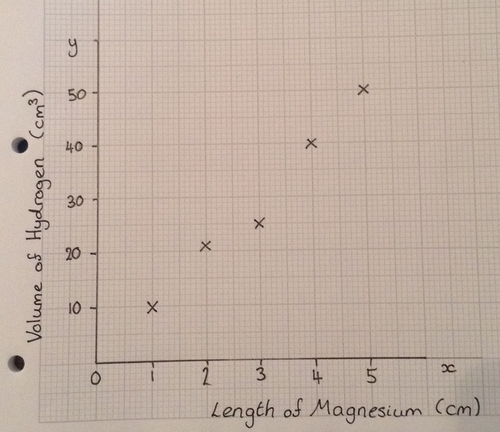
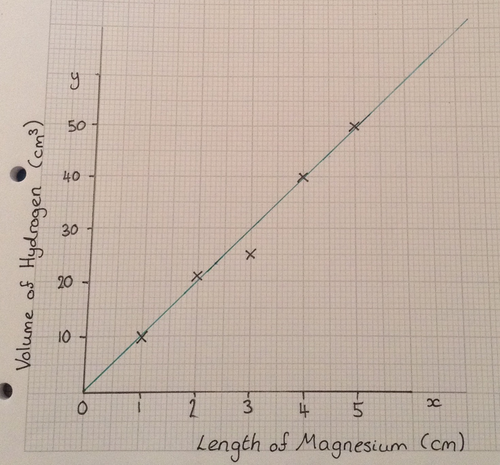
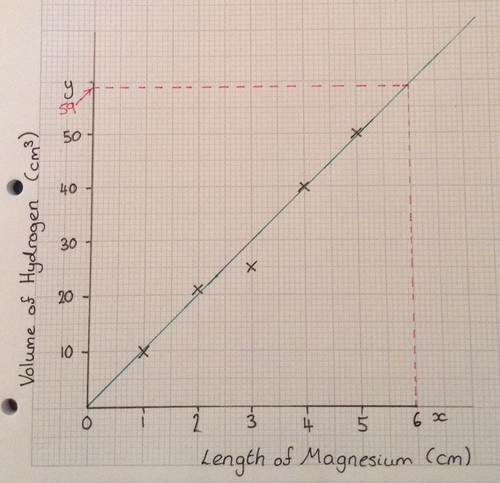
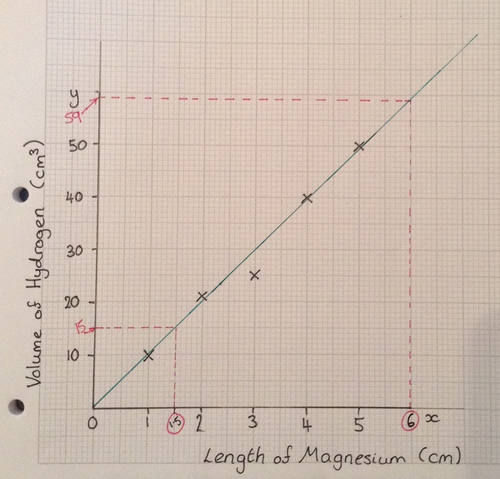
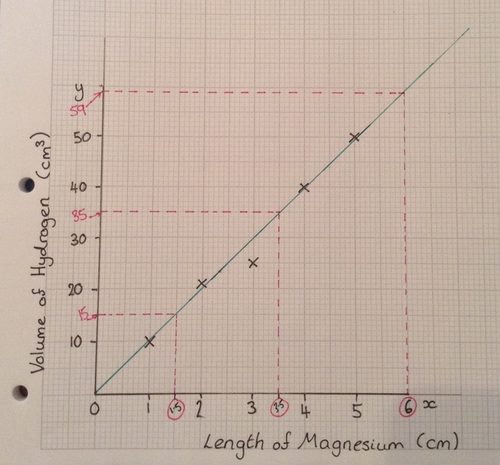
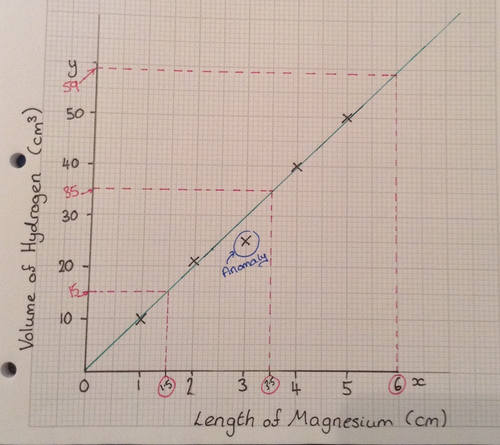
7. JPEG images showing a several hand-drawn versions of the graph, this may also be useful for students who aren't confident in starting to plot graphs. I've included sketches of the extrapolation of the data from the line of best fit, and highlighted the anomalous result.
This involves the students plotting some given results on a graph, identifying variables, extrapolation from a line of best fit and evaluating their work.
This task is suitable for KS3 students at level 3-7, however this could be adapted for KS4 students.
This resource pack comes with several parts;
1. PowerPoint presentation to introduce the task.
2. Word document printout for the students to stick in their books with just the task on, there is also a word document with both the task and level ladder combined onto one sheet to reduce printing.
3. Word document printout with a level ladder on so that the students can self/peer assess the work, there is also a column so the teacher can tick off the achieved criteria.
4. Word document containing a mark scheme, including exemplar answers and copies of the graph work.
5. Excel spreadsheet that can be used to automatically generate extended written feedback including improvement strategies for the teacher to give the students.
A guide on how to use this resource can be freely accessed at…
https://www.tes.com/teaching-resource/the-automarker-11191496
6. Word document printout writing frame to assist students who may benefit from additional help with this task.
7. JPEG images showing a several hand-drawn versions of the graph, this may also be useful for students who aren't confident in starting to plot graphs. I've included sketches of the extrapolation of the data from the line of best fit, and highlighted the anomalous result.
This involves the students plotting some given results on a graph, identifying variables, extrapolation from a line of best fit and evaluating their work.
This task is suitable for KS3 students at level 3-7, however this could be adapted for KS4 students.
Get this resource as part of a bundle and save up to 86%
A bundle is a package of resources grouped together to teach a particular topic, or a series of lessons, in one place.
Something went wrong, please try again later.
This resource hasn't been reviewed yet
To ensure quality for our reviews, only customers who have purchased this resource can review it
Report this resourceto let us know if it violates our terms and conditions.
Our customer service team will review your report and will be in touch.
£3.00