
Designed to be the fourth lessons for Year 7s (4/4).
Learning outcomes:
(*) Describe the three different types of data.
(*) Calculate means.
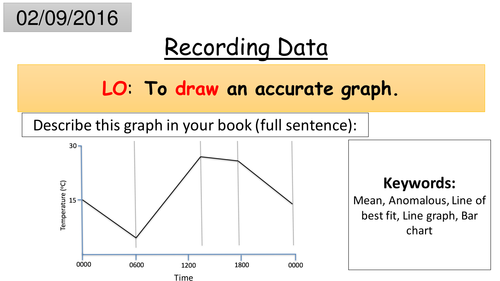
(*) Draw a suitable graph for given measurements.
Students recap the three types of variables and then learn the three types of data (Continuous, Discrete and Categoric).
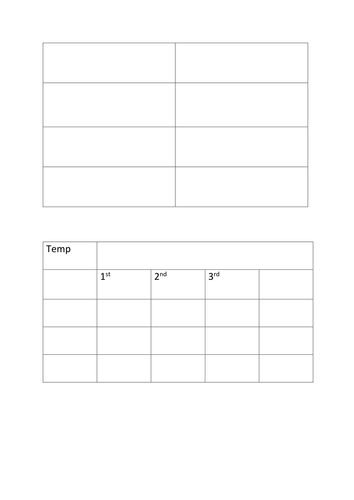
They are then shown how to fill in a results table (where the dependent and independent variables go).
They learn how to calculate means and how to plot this data onto a graph.
The steps in drawing a graph are laid out in a step by step method (designed to be down together with the whole class).
They are also informed on when to use line or bar charts.
Learning outcomes:
(*) Describe the three different types of data.
(*) Calculate means.
(*) Draw a suitable graph for given measurements.
Students recap the three types of variables and then learn the three types of data (Continuous, Discrete and Categoric).
They are then shown how to fill in a results table (where the dependent and independent variables go).
They learn how to calculate means and how to plot this data onto a graph.
The steps in drawing a graph are laid out in a step by step method (designed to be down together with the whole class).
They are also informed on when to use line or bar charts.
Something went wrong, please try again later.
A good resource but very expensive for one power point and one simplified worksheet.
Report this resourceto let us know if it violates our terms and conditions.
Our customer service team will review your report and will be in touch.
£3.00