
Please find within this download:
A detailed and engaging PowerPoint, Differentiated (SEN, LA, MA, HA, Mastery and Greater Depth) Worksheet with Answer Sheet for a complete lesson on this Year 4 statistics statement: solve comparison, sum and difference problems using information presented in bar charts, pictograms, tables and other graphs
The PowerPoint has the following features:
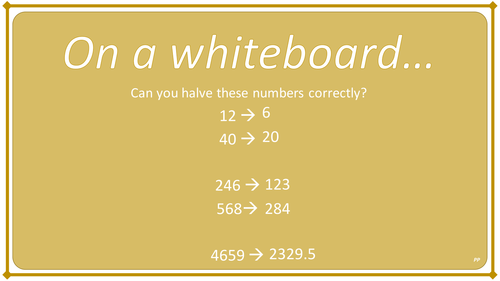
→ Differentiated starter activity (plus extension)
→ Extremely logical and simplistic explanations with animated examples and pictures to aid learning
→ Shows how to answer questions from graphs and tables, showing children precisely where they need to look to obtain different types of answers/data
→ A variety of different examples of graphs and tables are shown and worked through using teacher led and child led questions
→ Clear and precise instructions as to how we actually gain information from graphs and tables
→ Careful step by step guidance that can be moved forwards and backwards through easily
→ Shows exactly how to solve comparison, sum and difference problems using information presented in bar charts, pictograms, tables and other graphs
→ Learning Objective and differentiated success criteria which is clearly visible for all children
→ Animated count-down timer
→ Plenary activity to stretch learners knowledge by applying their skills to a more complex problem
The Word Document has the following features:
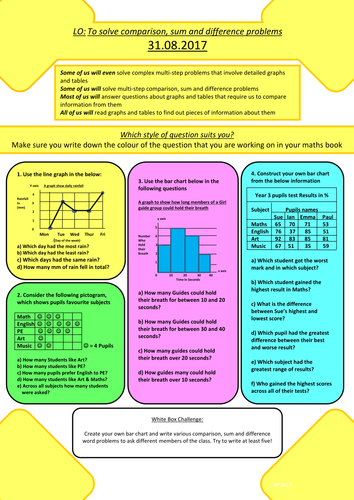
→ Differentiated activities from SEN to greater depth
→ Coloured activity boxes to help you quickly assign tasks to children
→ Learning objective and short date which automatically show the correct date
→ Differentiated success criteria that link with the PowerPoint
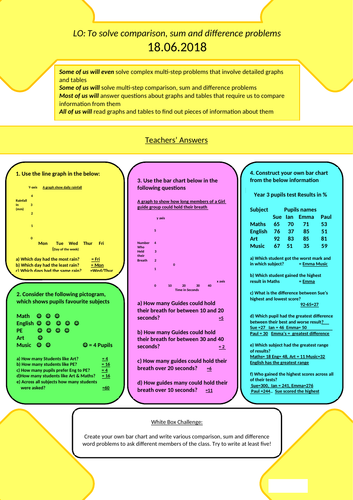
→ Answer sheet included for all questions
Explore our other Year 4 Place Value Lessons:
Interpret and present discrete and continuous data using appropriate graphical methods, including bar charts and time graphs
Solve comparison, sum and difference problems using information presented in bar charts, pictograms, tables and other graphs
Something went wrong, please try again later.
This resource hasn't been reviewed yet
To ensure quality for our reviews, only customers who have purchased this resource can review it
Report this resourceto let us know if it violates our terms and conditions.
Our customer service team will review your report and will be in touch.
£3.49