

This resource contains varied fluency questions, reasoning and a challenge question. Differentiated 2 ways and includes answers. Linked to Year 3 Spring block 3. Statistics - WRM Small Step - bar charts.
Curriculum links
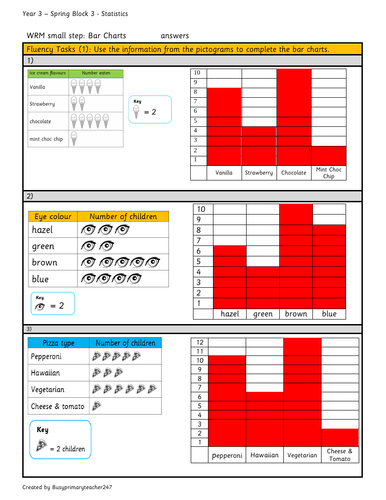
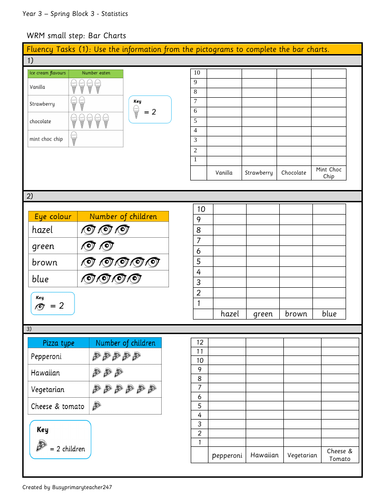
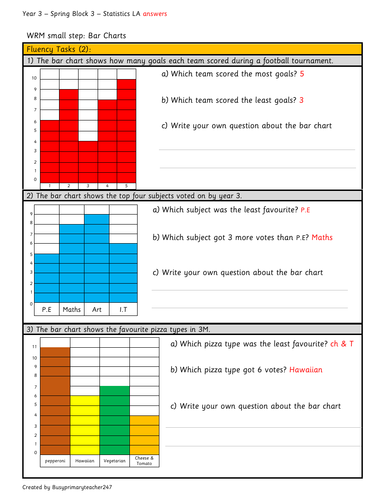
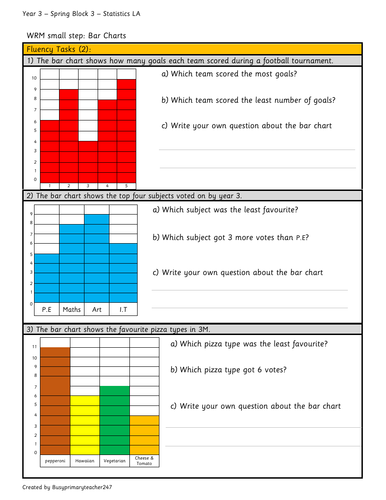
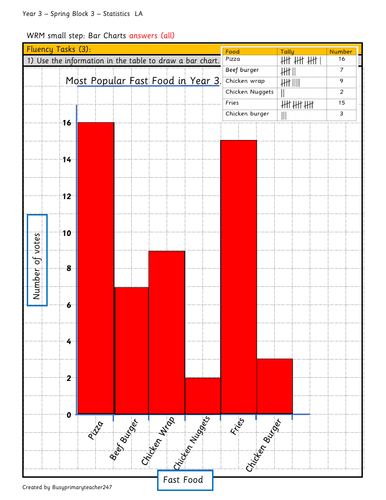
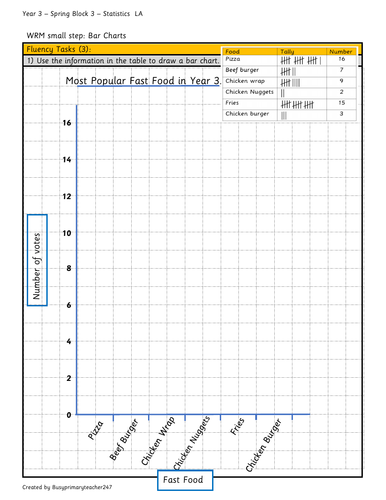
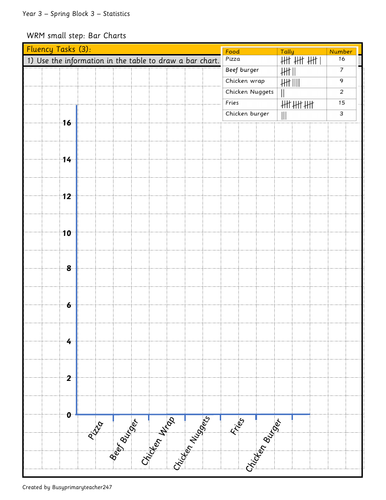
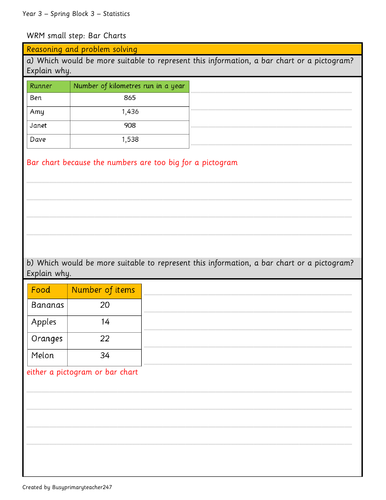
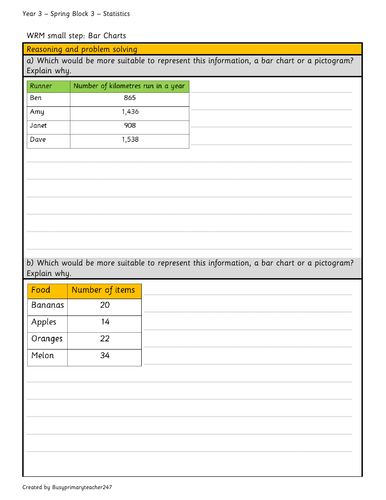
Interpret and present data using bar charts, pictograms and tables.
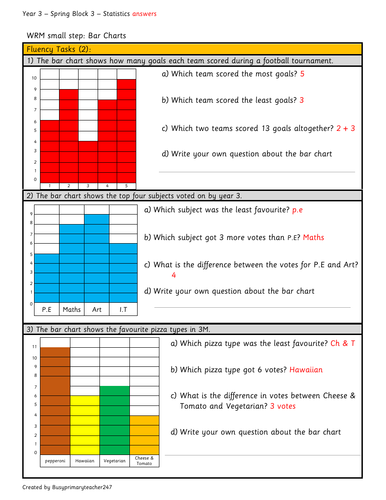
Solve one-step and two-step questions [for example, ‘How many more?’ and ‘How many fewer?’] using information presented
in scaled bar charts and pictograms and tables.
Something went wrong, please try again later.
This resource hasn't been reviewed yet
To ensure quality for our reviews, only customers who have purchased this resource can review it
Report this resourceto let us know if it violates our terms and conditions.
Our customer service team will review your report and will be in touch.
£5.00