
This presentation provides three days of teaching that cover the objectives:
- Use units of time in collecting data
- Draw line graphs
It includes starter activities, whole class teaching, group activities, practice sheets and mastery questions. It can be used on a variety of interactive whiteboards.
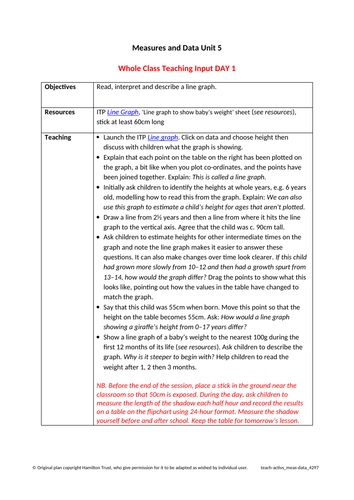
Day 1 Teaching
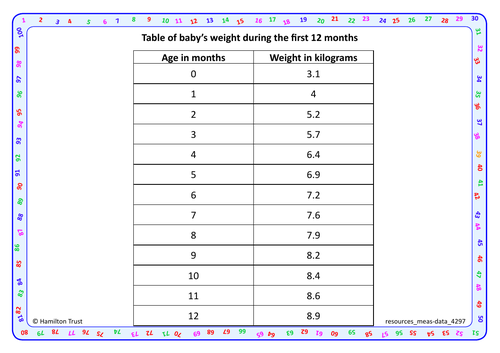
Use a line graph depicting children’s heights against their age on the ITP Line graph. Show how a line graph can enable us to read a child’s height for ages that are not plotted. Show a line graph of a baby’s weight to the nearest 100g during the first 12 months of its life and discuss.
Day 2 Teaching
Show the table of data of shadow length during the day. Sketch a line graph to show the lengths of a shadow at the different times of day, discussing an appropriate scale for both axes. Join the points with a curve. Use the graph to estimate the length of the shadow at intermediate points.
Day 3 Teaching
Display a calendar. Ring today’s date. Show children how we can see what day of the week it is. What will be the date on this day next week? Ring the last day of term; find how many weeks (or months) and days away it is. Count the weeks and days to the last day of term. Then work out length of the holidays. Rehearse lengths of months.
This teaching is part of Hamilton’s Year 4 Measures and Data block. Each Hamilton maths block contains a complete set of planning and resources to teach a term’s worth of objectives for one of the National Curriculum for England’s maths areas.
Get this resource as part of a bundle and save up to 18%
A bundle is a package of resources grouped together to teach a particular topic, or a series of lessons, in one place.
Something went wrong, please try again later.
This resource hasn't been reviewed yet
To ensure quality for our reviews, only customers who have purchased this resource can review it
Report this resourceto let us know if it violates our terms and conditions.
Our customer service team will review your report and will be in touch.
£5.00