
Two assessments for Year 4 statistics objectives. Includes
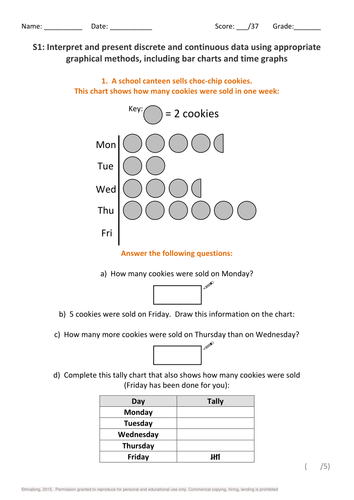
S1: Interpret and present discrete and continuous data using appropriate graphical methods, including bar charts and time graphs
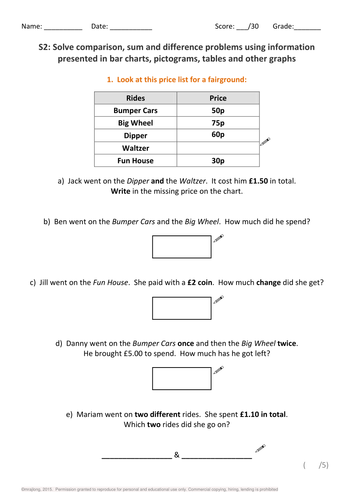
S2: Solve comparison, sum and difference problems using information presented in bar charts, pictograms, tables and other graphs
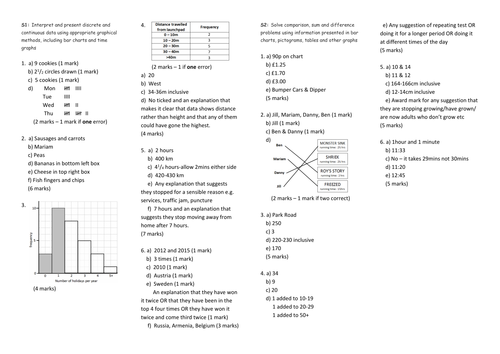
AND a mark scheme for all tests
Follow this link for all 42 assessments for all Year 4 maths objectives...
42 Year 4 Maths Mini-Assessments
More like this...
Year 4 Maths Assessments and Tracking
Year 4 Science Assessments
S1: Interpret and present discrete and continuous data using appropriate graphical methods, including bar charts and time graphs
S2: Solve comparison, sum and difference problems using information presented in bar charts, pictograms, tables and other graphs
AND a mark scheme for all tests
Follow this link for all 42 assessments for all Year 4 maths objectives...
42 Year 4 Maths Mini-Assessments
More like this...
Year 4 Maths Assessments and Tracking
Year 4 Science Assessments
Get this resource as part of a bundle and save up to 24%
A bundle is a package of resources grouped together to teach a particular topic, or a series of lessons, in one place.
Something went wrong, please try again later.
This resource hasn't been reviewed yet
To ensure quality for our reviews, only customers who have purchased this resource can review it
Report this resourceto let us know if it violates our terms and conditions.
Our customer service team will review your report and will be in touch.
£3.00