


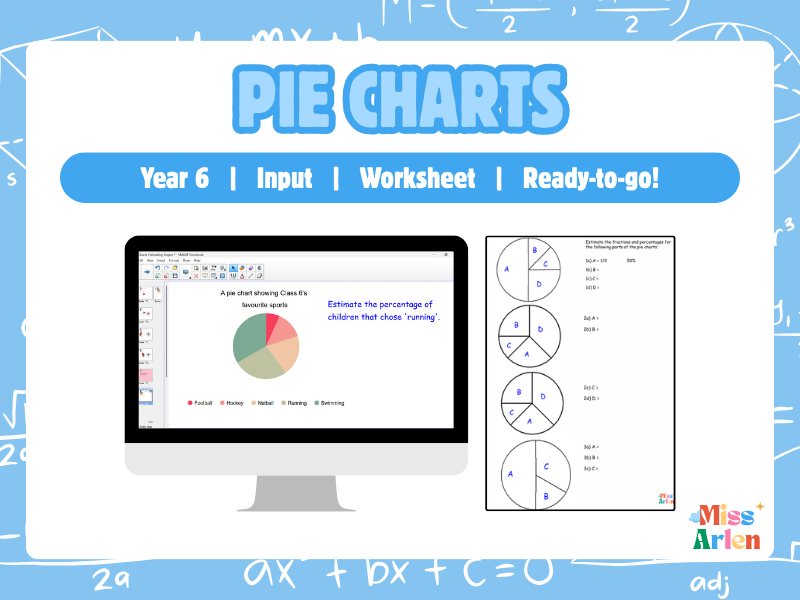

**A ready-to-teach Year 6 pie charts lesson designed to develop pupils’ ability to estimate, interpret and calculate fractions and percentages in KS2 maths.
This lesson is fully standalone and ready to teach, supporting pupils in understanding how data is represented in pie charts and how to interpret proportional values accurately.**
This Year 6 maths lesson focuses on interpreting pie charts, with a particular emphasis on estimating the size of segments using fractions and percentages.
Pupils develop their understanding of proportion by analysing visual data and estimating values based on the relative size of each section. The lesson strengthens their ability to move between fractions, percentages and visual representations of data.
Teachers can use the included Smart Notebook input slides to model strategies clearly and guide pupils through structured examples before independent practice.
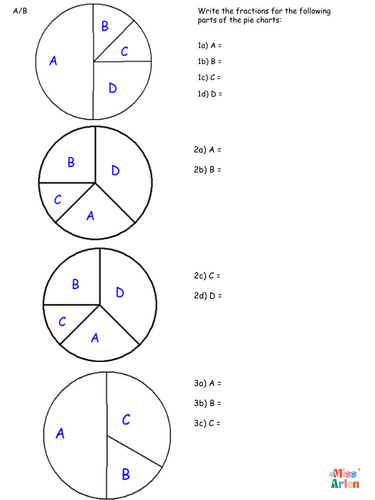
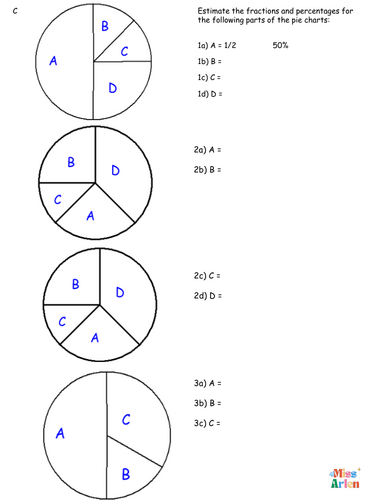
Pupils then complete a differentiated independent activity designed to support all learners while still providing appropriate challenge. The tasks build confidence with interpreting pie charts, estimating proportions and answering SATs-style questions.
This resource is ideal for Year 6 statistics lessons, KS2 data interpretation practice, SATs revision, or targeted intervention sessions.
What’s Included
✔ Smart Notebook input slides for teacher modelling
✔ Differentiated independent worksheets (2 levels)
✔ Plenary task
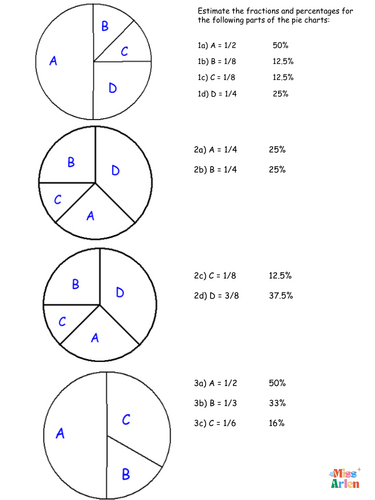
✔ Full answers included
Why Teachers Use This
✔ Ready-to-teach lesson with no planning required
✔ Develops understanding of fractions and percentages in context
✔ Builds confidence with interpreting pie charts
✔ Supports KS2 statistics and SATs-style reasoning
✔ Differentiation built in for mixed-ability Year 6 classes
Lesson Breakdown
✔ Input: Teacher modelling of pie chart interpretation
✔ Independent Task: Differentiated worksheets (2 levels)
✔ Plenary: Discussion and reasoning of answers
✔ Answers: Included for marking or self-assessment
Get this resource as part of a bundle and save up to 39%
A bundle is a package of resources grouped together to teach a particular topic, or a series of lessons, in one place.
Bundle
Year 6 Pie Charts – 3 Lessons
**A ready-to-teach Year 6 pie charts bundle containing three lessons covering estimating, interpreting and analysing information presented in pie charts.** This Year 6 maths bundle contains three lessons designed to develop pupils' confidence interpreting and reasoning with pie charts. **Across the three lessons, pupils practise:** ✔ Estimating the size of pie chart segments using fractions and percentages ✔ Using fractions and percentages of amounts to calculate values ✔ Interpreting information presented in pie charts ✔ Comparing categories within and between charts ✔ Finding totals and missing values ✔ Working backwards from known information ✔ Solving multi-step pie chart problems ✔ Explaining and justifying conclusions from data The lessons move from interpreting the size of segments towards calculating and analysing information, providing a useful sequence for developing pie chart reasoning. Each lesson can also be taught independently. **What's Included?** ✔ 3 complete Year 6 pie chart lessons ✔ Smart Notebook input slides ✔ Differentiated independent worksheets ✔ Plenary tasks ** Ideal for** ✔ Year 6 maths ✔ KS2 statistics ✔ Pie chart revision ✔ SATS preparation ✔ Data interpretation and reasoning *Year 6 pie charts, pie charts KS2, interpreting pie charts, pie chart reasoning, pie chart problems, fractions and percentages, statistics KS2, SATS maths, Year 6 statistics*
£2.95
Bundle
Year 6 Fractions, Percentages & Pie Charts
**A ready-to-teach Year 6 maths bundle containing five lessons covering fractions and percentages of amounts, pie charts and multi-step reasoning problems.** This Year 6 maths bundle brings together five lessons focused on applying fractions and percentages to calculations, word problems and data represented in pie charts. **Pupils develop their ability to:** ✔ Find fractions of amounts ✔ Find percentages of amounts ✔ Find missing fractions to one whole ✔ Solve fractions and percentages problems in context ✔ Estimate the size of pie chart segments ✔ Interpret pie charts using fractions and percentages ✔ Calculate values represented by pie chart segments ✔ Compare and analyse information presented in pie charts ✔ Solve multi-step problems involving fractions, percentages and data The lessons provide a useful progression from calculation skills towards applying those skills to more demanding reasoning and data interpretation. **What's Included?** ✔ 5 complete Year 6 lessons ✔ Smart Notebook input slides ✔ Differentiated independent worksheets ✔ Plenary tasks **Ideal for** ✔ Year 6 maths ✔ Fractions and percentages revision ✔ Statistics and pie charts ✔ SATS preparation ✔ Mathematical reasoning *Year 6 fractions, Year 6 percentages, fractions of amounts, percentages of amounts, pie charts KS2, interpreting pie charts, pie chart reasoning, fractions and percentages, SATS maths, Year 6 statistics*
£4.45
Something went wrong, please try again later.
This resource hasn't been reviewed yet
To ensure quality for our reviews, only customers who have purchased this resource can review it
Report this resourceto let us know if it violates our terms and conditions.
Our customer service team will review your report and will be in touch.
£1.45