Secondary maths collection
Welcome secondary maths teachers! Are you looking for quality assured resources, designed to make lesson planning easier? Spanning across multiple topics and key stages, this extensive collection, hand-picked by members of the Tes maths panel, is the perfect starting point...
Hand-picked by:


Calculating averages and range from a list of data
Lesson presentations and activities
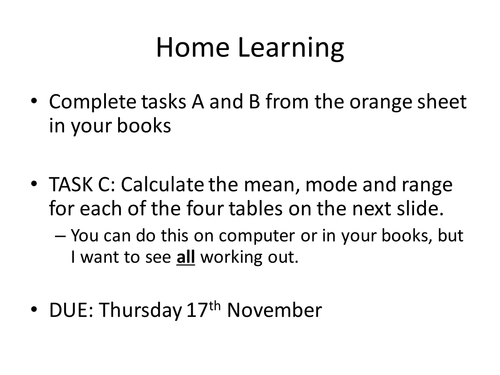
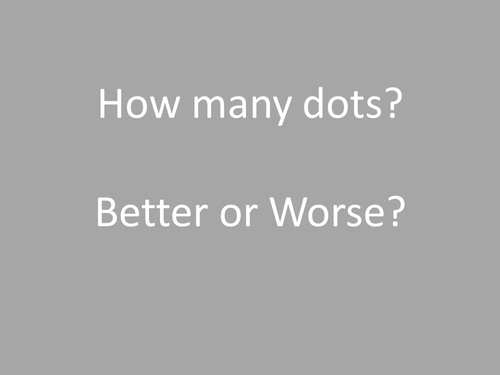
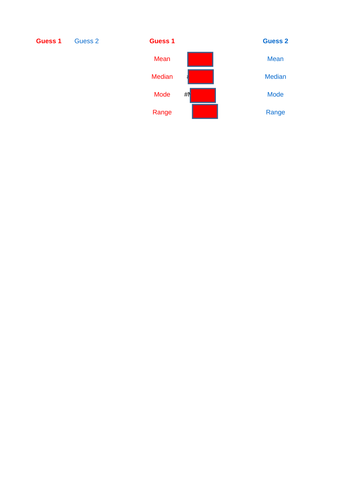
This is a video to accompany my article for the TES Magazine ('Dotty Thinking') that offers up a simple, fun idea to get students engaged and making meaningful data comparisons, including mean, median, mode, range and a whole host of statistical diagrams including cumulative frequency, histograms and bar charts. Click the links below to see the article and download the resources (Video tutorial, PowerPoint and Excel). Ideal for KS3 and GCSE students.
Reviews
annamak6 years ago
thank you
TES Resource Team8 years ago
Thank you for publishing your resource. It has been selected to be featured in a new secondary maths collection.
melvinyoung738 years ago
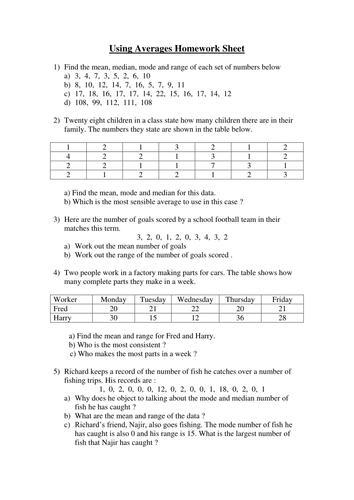
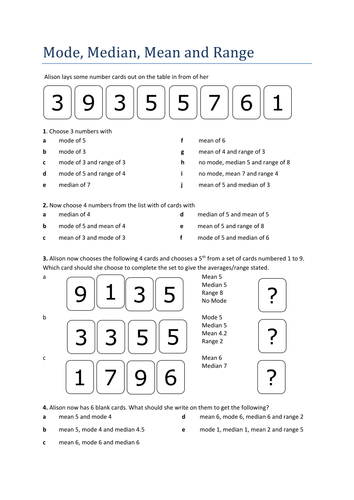
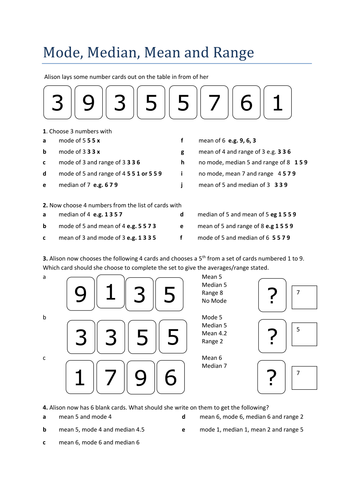
Questions on Mean, Mode, Median & Range that are not what students are used to seeing. Good for consolidation or extension. Some exam questions have been written this way in recent years. Have attached some solutions and the word file in response to some people saying some were impossible. I've corrected those that I can spot
Reviews
3buzzards5 years ago
Really great to find something a bit different for our high achieving y6s, thank you.
atkinsonr25 years ago
panthula6 years ago
Super worksheet
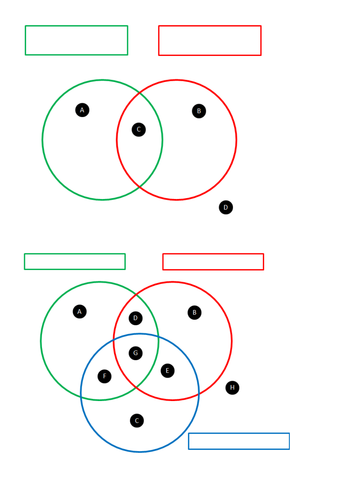
This is a rich Venn Diagram activity on Averages and Range, including mean, median, mode and range.
To access all the Venn Diagram activities in this collection, as well as teaching notes, please visit: http://www.mrbartonmaths.com/venn.htm
Here is why I love Venn Diagram activities so much:
1) Students can always make a start. If they can think of a number/expression/object or whatever it might be, it has to go in one of the regions on the diagram, so they are up and running
2) The more regions student find, the more challenging the task gets, which adds a nice element of differentiation
3) They are incredibly versatile, and can be used for almost all maths topics for all ages and abilities
4) They are easy to tweak by simply changing one of the circle labels if you find they are too difficult/easy
5) Students can create their own as an extension task
I hope you and your students enjoy them.
Reviews
nadhimshamoon7 years ago
yolandewchristian8 years ago
londonsecondary8 years ago


Practice questions, homeworks and assessments
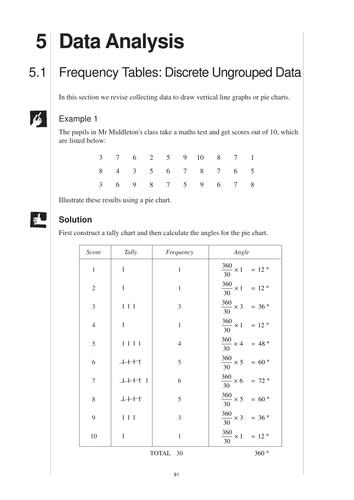
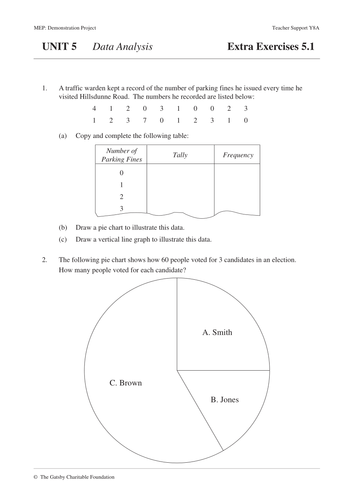
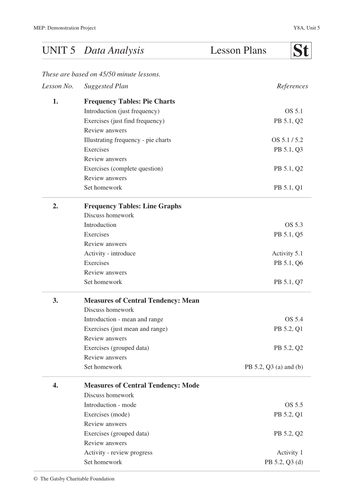
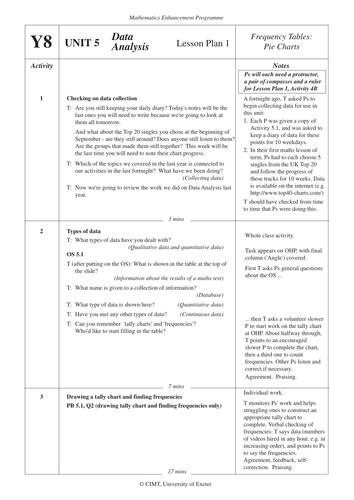
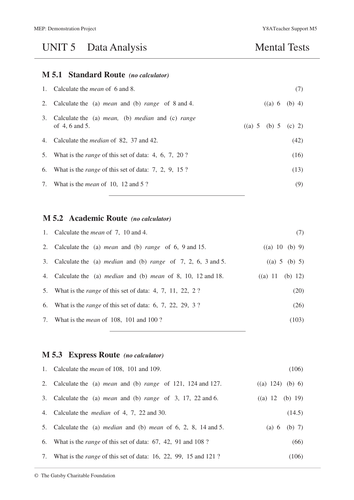
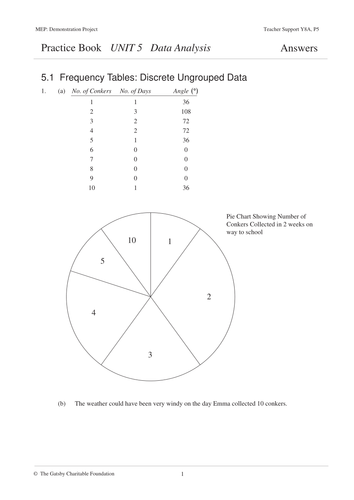
Worksheets and activities. Suitable for KS4.Representing and interpreting data. The topic of Data Analysis from the Year 8 book of the Mathematics Enhancement Program. For information about these resources and an index for the whole collection please visit http://www.mrbartonmaths.com/CIMT.htm Keywords: Average, Mean, Median, Mode, Spread, Range, Dispersion, Frequency Table, Frequency Diagram, Pie Chart, Line Graph, Discrete, Continuous, Grouped, Ungrouped, Data.
Reviews
kooldude5 years ago
Great time saving resources. Thank you for sharing.
lj_n7 years ago
john_gozo8 years ago
Five more questions that Clive seems a bit confused on. These questions involve median and mean from sets of data, plus calculatiing the mean from a frequency table and estimating the mean from grouped data. I will probably throw a couple more questions in verbally (find the modal group etc) whilst discussing the answers and reasons why as a class.
Reviews
cree_giraud3 years ago
Rec'd by craig barton - great resource
Alyena6 years ago
Martin65628 years ago
Fantastic resource. Thanks for sharing.
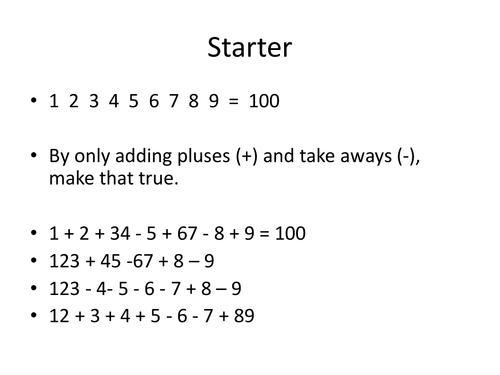
This should bring about plenty of discussion. Four "spiders" of increasing difficulty asking students to complete a list of numbers to make the average and range properties true. A couple of typos corrected.
Reviews
JamesF4 months ago
Brilliant thank you
simon914 years ago
Excellent, thank you
marthadi4 years ago
Great resource!