Secondary maths collection
Welcome secondary maths teachers! Are you looking for quality assured resources, designed to make lesson planning easier? Spanning across multiple topics and key stages, this extensive collection, hand-picked by members of the Tes maths panel, is the perfect starting point...
Hand-picked by:


Bar chart
Lesson presentations and activities
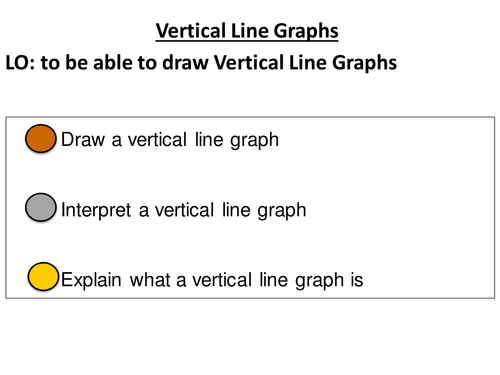
I have created this PowerPoint to teach Vertical Line Graphs which (I understand) to now be included within the new maths curriculum. However, I really struggled to find ANY resources to teach it. This is fairly basic with no really obvious differentiation except for some 'thinking and understanding' questions; but it has an explanation and worksheet with answers so I thought I would share it in case anyone else out there needs a resource for this. It fits in with the AET Mathematics SOW for Unit 8 Stage 7. And the worksheet is from an old workbook for the 'New Maths Framework' by Trevor Senior. Please leave a review if you download and use.
Reviews
ColinDeanoDean4 years ago
Terrific! Great to see the solutions on a powerpoint too.
Cmkp5 years ago
12326 years ago
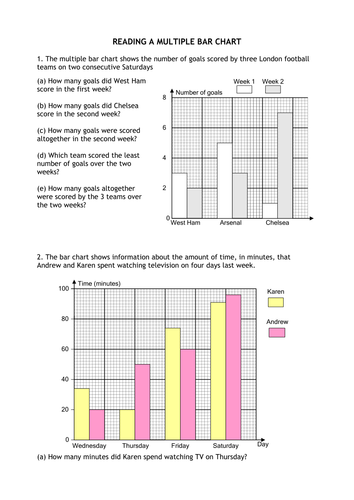
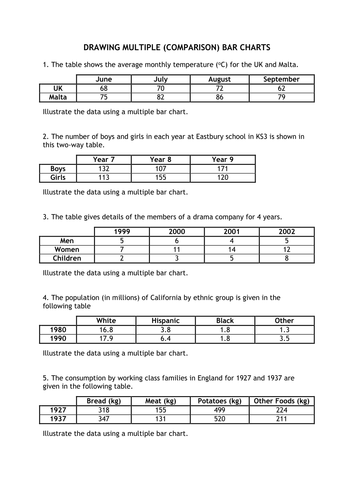
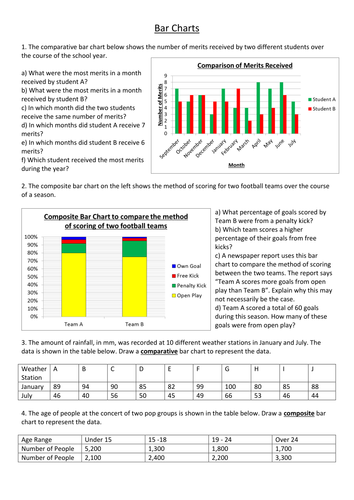
A PPT and accompanying worksheet covering how to draw and interpret comparative and composite bar charts.
Reviews
MrsHGuilfoyle6 years ago
Thank you for sharing your work, it was exactly what I needed.
hymak6 years ago
mathsdude6 years ago


Practice questions, homeworks and assessments
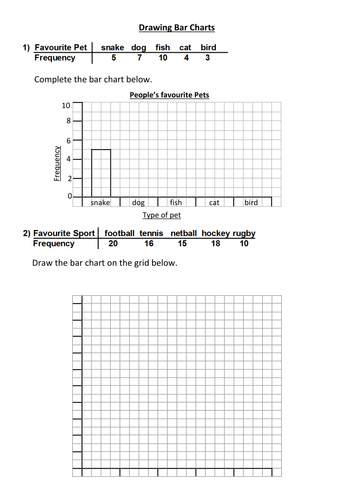
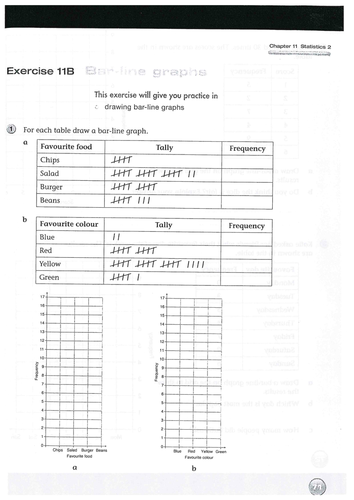
A worksheet for students who find drawing bar charts challenging. Scaffolded and gradually increases in difficulty until students are drawing and labelling their axis independently.
Reviews
Julianaha year ago
Great resources. Thank you
GTS4 years ago
A great differentiated worksheet, thank you.
BecBrett5 years ago
A great resource - thank you!
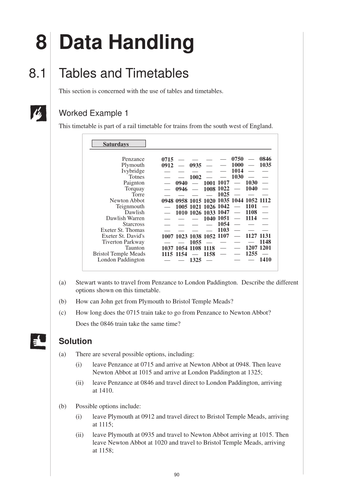
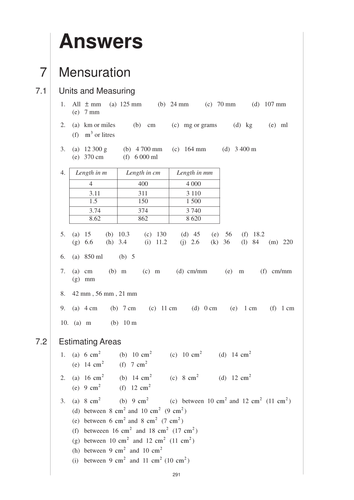
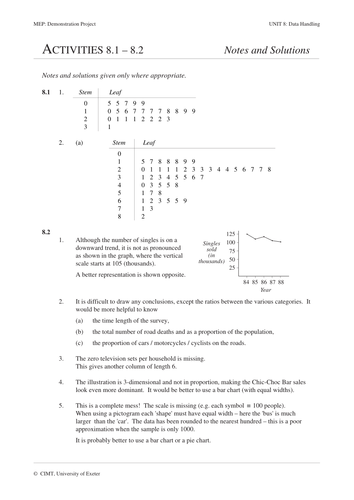
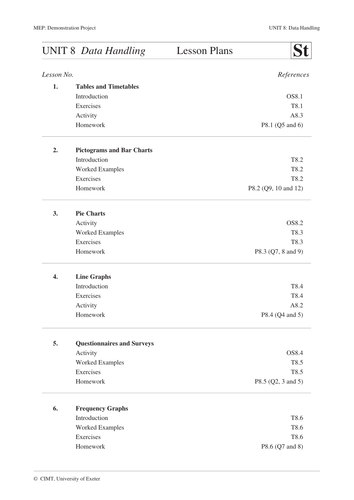
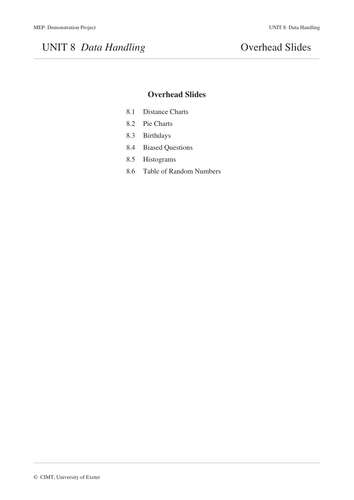
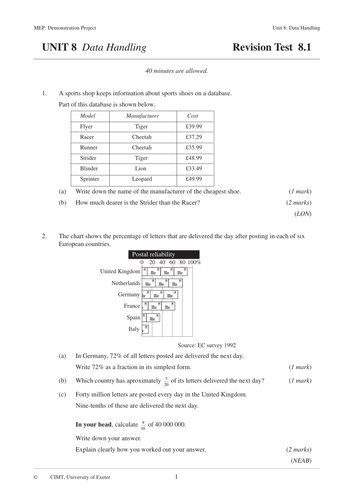
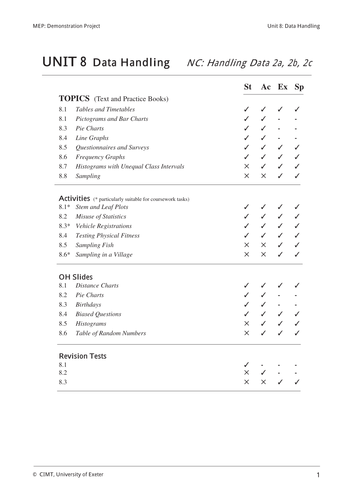
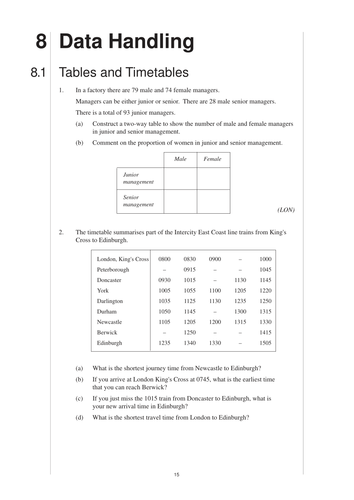
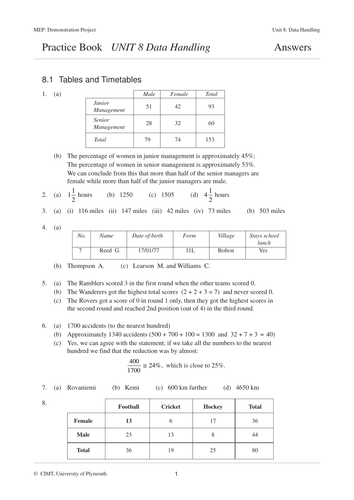
The topic of Data Handling from the GCSE (14 -16 year olds) books of the Mathematics Enhancement Program. For information about these resources and an index for the whole collection please visit https://www.cimt.org.uk/projects/mepres/allgcse/allgcse.htm
Keywords: Questionnaire, Analysis, Question, Biased, Unbiased, Design, Leading, Line Graph, Bar Chart, Process, Display, Conclude, Evidence, Sample, Survey, Multiple Choice, Pilot, Study, Hypothesis, Trend, Bar Chart, Pie Chart, Line Graph, Presentation, Data, Statistics, Scatter Diagram, Graph, Plot, Co-ordinates, Correlation,
Reviews
BPS51116 years ago
Thank you
Mucayit7 years ago
I got great ideas and modify the materials for my students. Ill be teaching the topic two months later so the outcome is still waiting. Thanks for great ideas.
DimitrisGeorgalis9 years ago
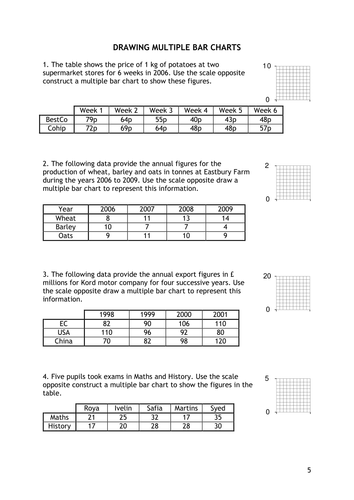
Resource for delivering multiple/comparative bar charts to KS3/KS4 students. Powerpoints used to deliver the topic. Worksheets to give practise. There are 2 paths for delivery-one for when a scale is given to use and the other for the student to decide on a suitable scale. Part of a Unit in delivering graphical representation of data in the Edexcel GCSE Statistics course, chapter 2 of the textbook that goes with the course.
Reviews
skilty23 years ago
Useful resource. I did not know the UK had an average monthly temperature of 68 degree Celsius in June!
ben_hughes24 years ago
Great presentation & questions
rumunbhatti6 years ago
Useful Resource