International
Resources
Topical and themed
Pre-K and Kindergarten
Elementary
Middle school
High school
Special education
Education Jobs
Schools directory
News
Courses
Store
Resources
Education Jobs
Schools directory
News
Search
Tes for schools
Log in
Register
for free
Resources
Education Jobs
Schools directory
News
Magazine
Courses
Log out
Help
Home feed
My list
Courses
My Jobs
Job alerts
My CV
Career preferences
Resources
Author dashboard
Settings
Edit account
Log out
Home
Resources
Jobs
Schools directory
News
Magazine
Courses
Register for free
Log in
Help
McArdleTeaching
Add a resource
Edit shop
Average Rating
4.04
(based on 9 reviews)
McArdleTeaching
Average Rating
4.04
(based on 9 reviews)
Edit shop
Add a resource
18
Uploads
30k+
Views
15k+
Downloads
All resources
Highest rated
Relevance
Newest
Highest rated
Lowest price
McArdleTeaching
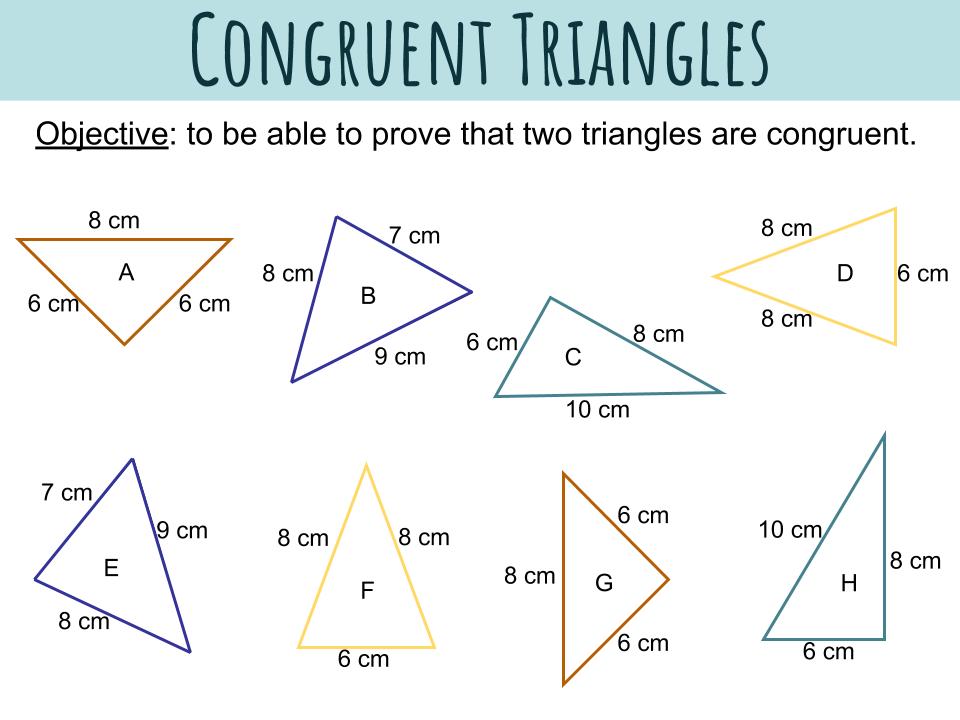
Congruent Triangles
(5)
McArdleTeaching
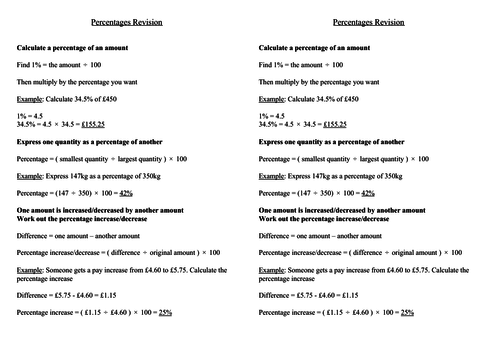
Percentages revision sheet
(1)
McArdleTeaching
Probability
(1)
McArdleTeaching
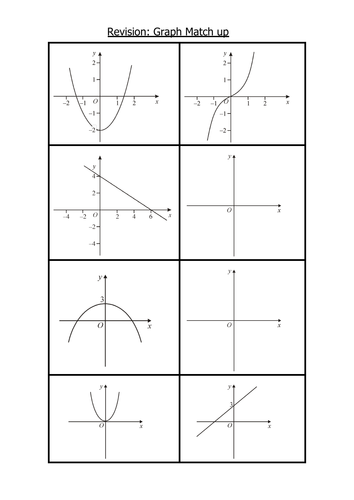
Linear and Quadratic Graph match up activity
(1)
McArdleTeaching
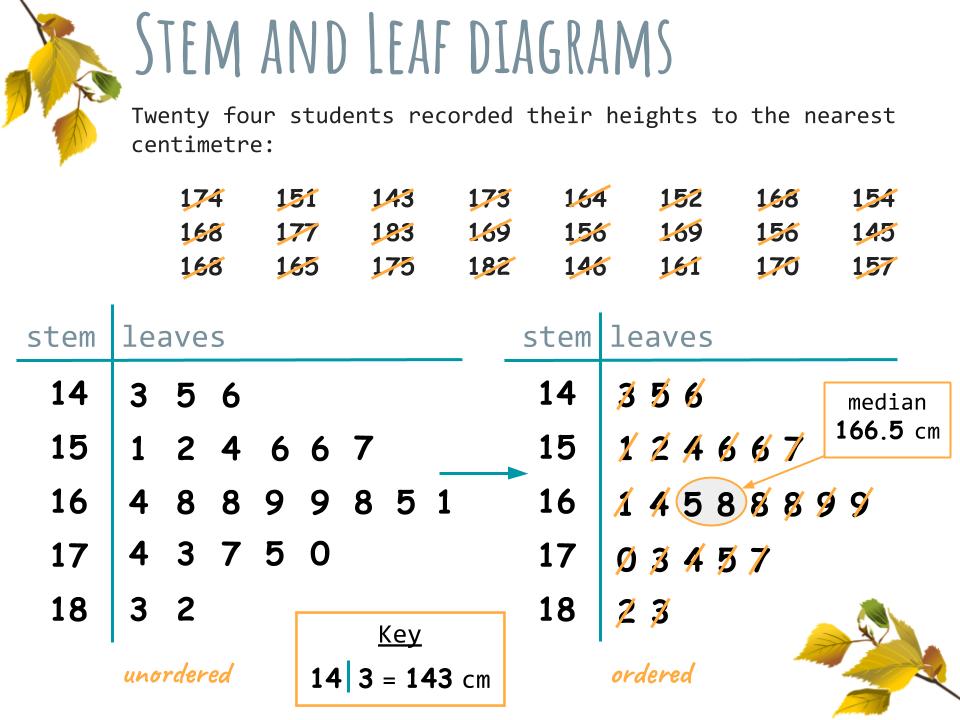
Stem and Leaf diagrams
(1)
McArdleTeaching
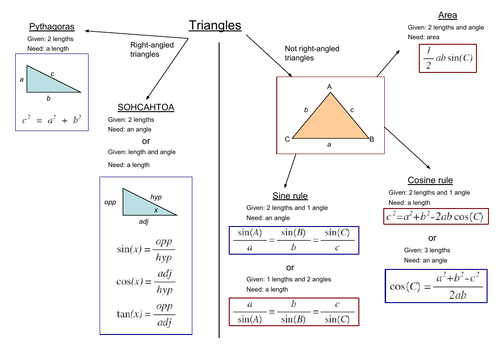
Revision sheet showing formula for triangles
(0)
McArdleTeaching
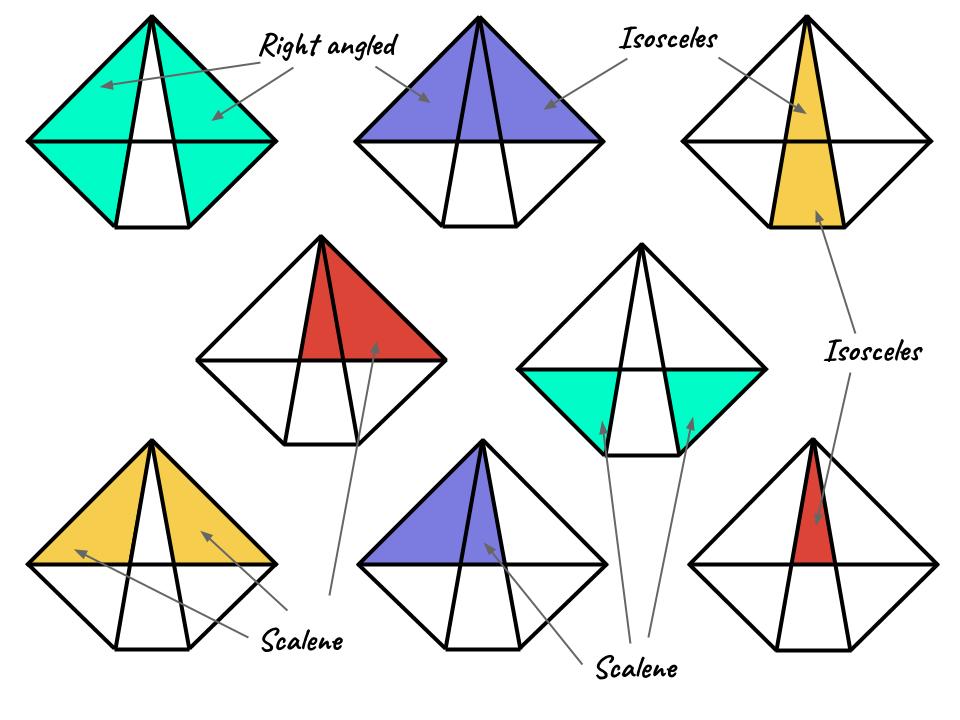
Triangles reasoning starter
(0)
McArdleTeaching
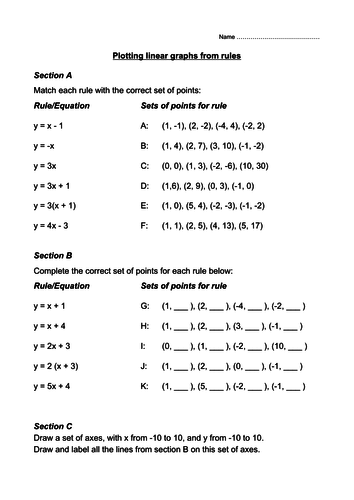
Linear graphs
(0)
McArdleTeaching
Averages for grouped data
(0)
McArdleTeaching
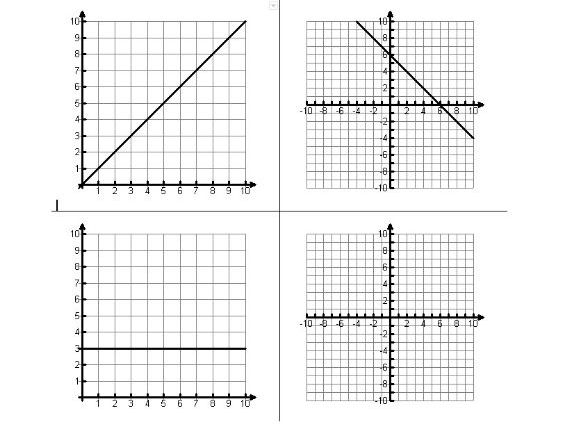
Linear graphs match up activity
(0)
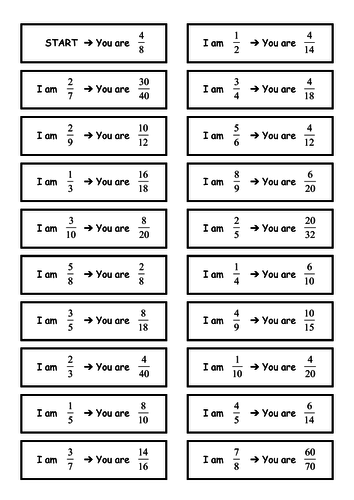
McArdleTeaching
Equivalent fractions follow me cards
(0)
McArdleTeaching
Sequences investigation (using square and hexagonal tile patterns)
(0)
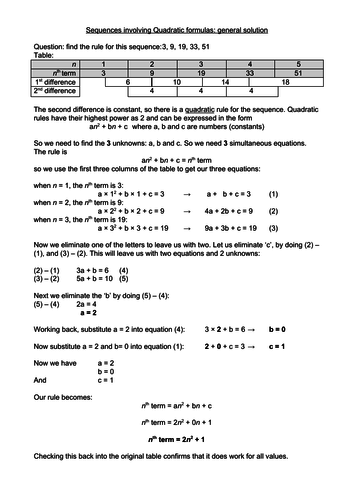
McArdleTeaching
Quadratic Sequence Examples
(0)
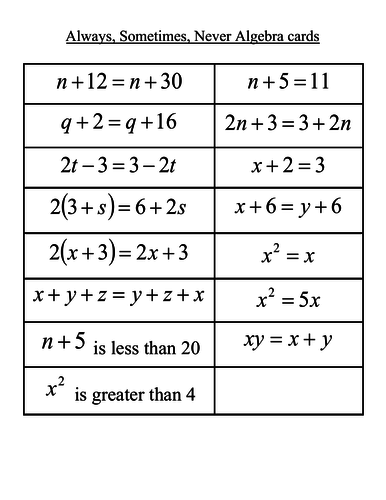
McArdleTeaching
Always, Sometimes, Never Algebra cards
(0)
McArdleTeaching
Negative Numbers
(0)
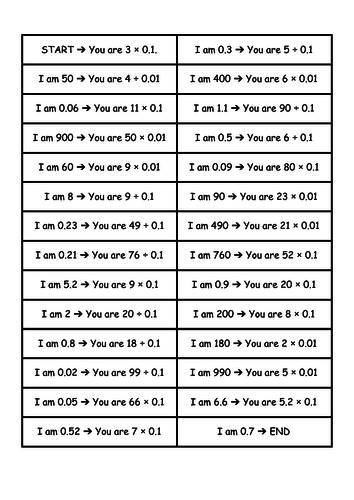
McArdleTeaching
Multiplying and dividing by decimals follow me cards
(0)
McArdleTeaching
Ordering decimal numbers
(0)
McArdleTeaching
Data collection and types of data
(0)