International
Resources
Topical and themed
Pre-K and Kindergarten
Elementary
Middle school
High school
Special education
Education Jobs
Schools directory
News
Courses
Store
Resources
Education Jobs
Schools directory
News
Search
Tes for schools
Log in
Register
for free
Resources
Education Jobs
Schools directory
News
Magazine
Courses
Log out
Help
Home feed
My list
Courses
My Jobs
Job alerts
My CV
Career preferences
Resources
Author dashboard
Settings
Edit account
Log out
Home
Resources
Jobs
Schools directory
News
Magazine
Courses
Register for free
Log in
Help
GeogebraFan Shop
Add a resource
Edit shop
Average Rating
1.00
(based on 1 reviews)
GeogebraFan Shop
Average Rating
1.00
(based on 1 reviews)
Edit shop
Add a resource
6
Uploads
5k+
Views
187
Downloads
All resources
Mathematics
Maths for early years
Physics
More
Mathematics
Relevance
Relevance
Newest
Highest rated
Lowest price
biturner2003
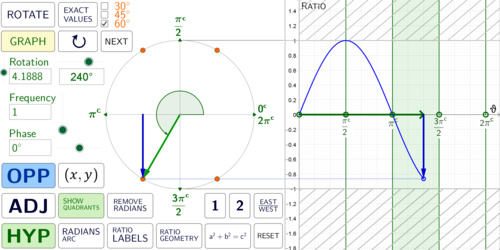
The Unit Circle & Periodic Functions (Geogebra)
(0)
biturner2003
The Normal Distribution (Geogebra)
(1)
biturner2003
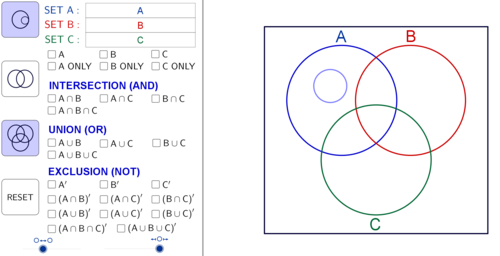
Venn Diagram Generator (Geogebra)
(0)
biturner2003
Functions & Limits (Geogebra)
(0)
biturner2003
Venn Diagram (Geogebra)
(0)
biturner2003
Binomial & Normal Probability Distribution (Geogebra)
(0)