Hero image

Maths-support's Centre

Average Rating3.55
(based on 112 reviews)

I am a Mathematics teacher, 22 years experience in KS3, IGCSE and IB Diploma, Studies, Standard Level and Higher Level. You will find many resources for different levels

356Uploads

159k+Views

42k+Downloads

I am a Mathematics teacher, 22 years experience in KS3, IGCSE and IB Diploma, Studies, Standard Level and Higher Level. You will find many resources for different levels
Percentage error
oralhurtoralhurt

Percentage error

(2)
Power Point presentation, 8 slides, Explaining how to calculate percentage error in a measurement, based on IB Mathematical Studies Syllabus. For a preview of the power point copy the following link on your browser: https://drive.google.com/file/d/0B8z00qLZV7OlNU56R0cwbGtFNE0/view?usp=sharing
Normal probability calculations using GDC.
oralhurtoralhurt

Normal probability calculations using GDC.

(0)
Power Point presentation, 19 slides, Explaining how to use the GDC to calculate probabilities from normal distributions, based on IB Mathematical Studies Syllabus. More resources www.mathssupport.org
Equations of tangent and normal to a curve
oralhurtoralhurt

Equations of tangent and normal to a curve

(1)
Power Point presentation, 9 slides, Explaining how to find the equation of a the tangent to a curve at a point and the normal to a curve at a point, based on the NEW IB Mathematics Syllabus. More resources www.mathssupport.org
Integration by substitution
oralhurtoralhurt

Integration by substitution

(1)
PowerPoint presentation, 11 slides, Explaining how to integrate composite functions using the method of substitution. Based on the Analysis and Approaches IB Mathematics Higher l
Profit and loss
oralhurtoralhurt

Profit and loss

(1)
Power Point presentation, 9 slides, Explaining with examples what profit is and how to calculate it; what loss is and how to calculate it. For a preview of the power point copy the following link on your browser: https://drive.google.com/file/d/0B8z00qLZV7OlS1dPZElObFJONWs/view?usp=sharing
Properties of limits
oralhurtoralhurt

Properties of limits

(0)
Power Point presentation, 5 slides, Explaining how to calculate limits and asymptotes using the properties of limits, based on IB Mathematics Higher Level Syllabus. More resources www.mathssupport.org
Applications of quadratic functions.
oralhurtoralhurt

Applications of quadratic functions.

(0)
Power Point presentation, 13 slides, Explaining how to solve real life situations using quadratic functions, based on IB Standard Level Syllabus. For more resources www.mathssupport.org
Introduction to limits and convergence
oralhurtoralhurt

Introduction to limits and convergence

(0)
Power Point presentation, 26 slides, explaining with an activity what limits are and how to find the limit of a function graphically and numerically, using a GDC. Based on the New IB Mathematics Syllabus. For more resources www.mathssupport.org
The geometric properties of quadrilaterals
oralhurtoralhurt

The geometric properties of quadrilaterals

(0)
PowerPoint presentation, 27 slides, Explaining the geometrical properties of the following quadrilaterals: square, rectangle, parallelogram, rhombus, kite, arrowhead, and trapezium, considering angles, sides, diagonal lines, lines of symmetry, rotational symmetry, based on KS3 National curriculum. More resources www.mathssupport.org
Bayes' theorem
oralhurtoralhurt

Bayes' theorem

(0)
Power point presentation, 15 slides explaining the Bayes’ theorem in a way that can be understood by the students, using examples to ake it more clear. based on the IB Mathematics HL syllabus. If you want to find more resources, visit our website www.mathssupport.net
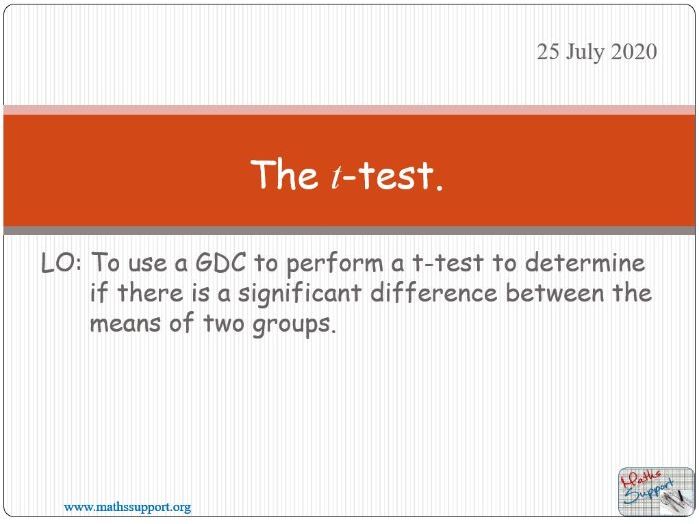
The t-test
oralhurtoralhurt

The t-test

(0)
PowerPoint presentation, 14 slides, Explaining what the t-test is, using examples to show how to use GDC to calculate the t-test and decide on accepting or rejecting a hypothesis. Based on the IB Mathematics: Application and interpretations Standard level Syllabus. If you want to find more resources, visit our website www.mathssupport.net
Integration - Volumes of revolution
oralhurtoralhurt

Integration - Volumes of revolution

(0)
Power Point presentation, 15 slides, Explaining how to calculate the volume of a shape generated by rotating a curve around the x-axis, or about the y-axis, using definite integrals , based on IB Mathematics: Analysis and approaches, Higher Level Syllabus. If you want to find more resources, visit our website www.mathssupport.net
Change of base of a logarithm.
oralhurtoralhurt

Change of base of a logarithm.

(0)
Power Point presentation, 10 slides, Explaining how to change log expressions of any base into logs base 10 or ln, based on IB Mathematics: Analysis and approaches, Standard Level Syllabus. More resources www.mathssupport.org
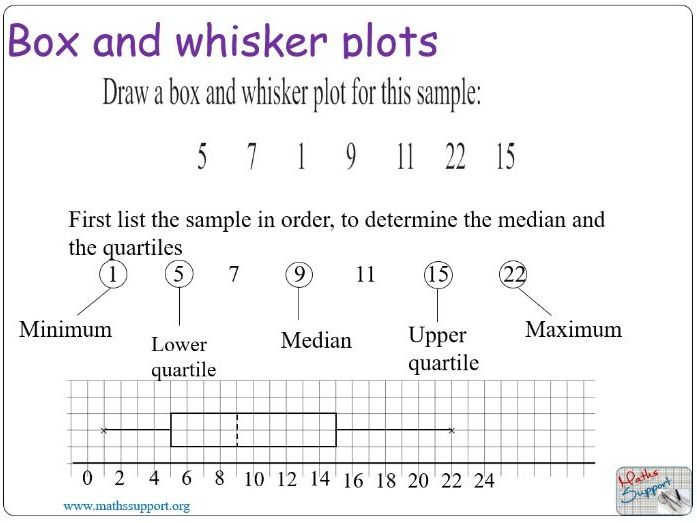
Statistical diagrams. Box and whisker plots.
oralhurtoralhurt

Statistical diagrams. Box and whisker plots.

(5)
KS3 Maths Tutorial and Activity. Powerpoint presentation. Representing Data. Interpreting Data. How to draw a box and whisker graph and compare data from the median, interquartile, upper quartile, interquartile range and range.
Composite Functions: Algebra
oralhurtoralhurt

Composite Functions: Algebra

(11)
Presentation on algebra; function, functions, composite. Please write comment. It is important to receive your feedback If you want to find more resources, visit our website www.mathssupport.net
Quadratic models
oralhurtoralhurt

Quadratic models

(1)
Power Point presentation, 13 slides, Explaining how to model real life situations that have a parabolic behavior using quadratic functions. Based on the IB Mathematics: Applications and interpretations Standard level syllabus. For more resources www.mathssupport.org
Binomial distribution
oralhurtoralhurt

Binomial distribution

(0)
Power Point presentation, 18 slides, Explaining how to use the GDC to calculate probabilities from binomial distributions, based on IB Mathematical Standard Level Syllabus. More resources www.mathssupport.org