International
Resources
Topical and themed
Pre-K and Kindergarten
Elementary
Middle school
High school
Special education
Education Jobs
Schools directory
News
Courses
Store
Resources
Education Jobs
Schools directory
News
Search
Tes for schools
Log in
Register
for free
Resources
Education Jobs
Schools directory
News
Magazine
Courses
Log out
Help
Home feed
My list
Courses
My Jobs
Job alerts
My CV
Career preferences
Resources
Author dashboard
Settings
Edit account
Log out
Home
Resources
Jobs
Schools directory
News
Magazine
Courses
Register for free
Log in
Help
The Primary Collection
Add a resource
Edit shop
Average Rating
4.29
(based on 1093 reviews)
The Primary Collection
Average Rating
4.29
(based on 1093 reviews)
Edit shop
Add a resource
254
Uploads
2166k+
Views
2099k+
Downloads
All resources
Whole school
English
Mathematics
Languages
Primary science
Pedagogy and professional development
Citizenship
Personal, social and health education
Physical education
Government and politics
History
Literacy for early years
New teachers
Physical development
Special educational needs
More
English
Newest
Relevance
Newest
Highest rated
Lowest price
primaryclass
2025 KS1 SATs Reading Test Mark Scheme on a Page
(0)
primaryclass
2025 KS1 SATs Grammar, Punctuation and Spelling Test Mark Scheme on a Page
(0)
primaryclass
2025 KS2 SATs Grammar, Punctuation and Spelling Test Mark Scheme on a Page
(0)
primaryclass
2025 KS2 SATs Reading Test Mark Scheme on a Page
(0)
primaryclass
2024 Phonics Check Question Level Analysis
(0)
primaryclass
2024 KS2 Reading Test and Question Level Analysis
(0)
primaryclass
2024 KS2 SATs Grammar, Punctuation & Spelling Test and Question Level Analysis
(0)
primaryclass
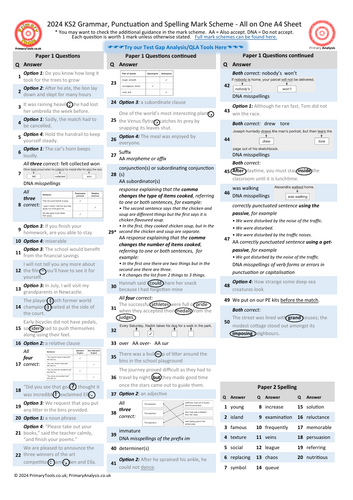
2024 KS2 SATs Grammar, Punctuation and Spelling Test Mark Scheme on a Page
(0)
primaryclass
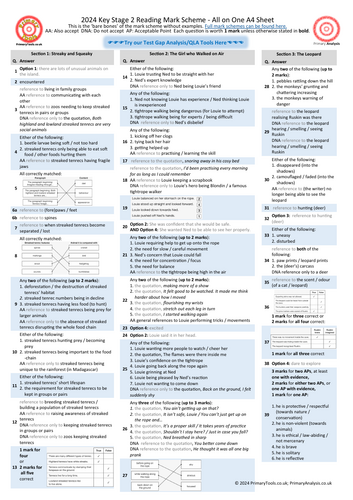
2024 KS2 SATs Reading Test Mark Scheme on a Page
(0)
primaryclass
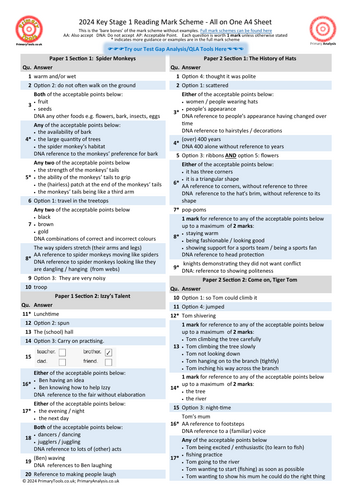
2024 KS1 SATs Reading Test Mark Scheme on a Page
(0)
primaryclass
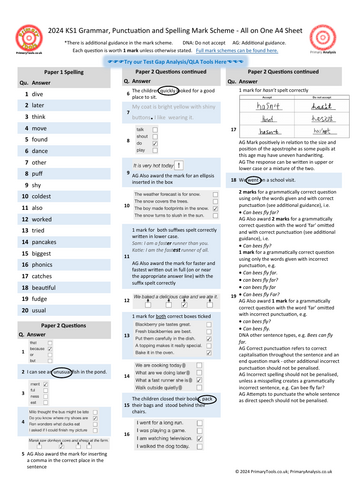
2024 KS1 SATs Grammar, Punctuation and Spelling Test Mark Scheme on a Page
(0)
primaryclass
2024 KS1 Grammar, Punctuation & Spelling Test and Question Level Analysis
(0)
primaryclass
2024 KS1 Reading Test and Question Level Analysis
(0)
primaryclass
2023 KS1 SATs Reading Test & Comprehensive Question Analysis Tool
(0)
primaryclass
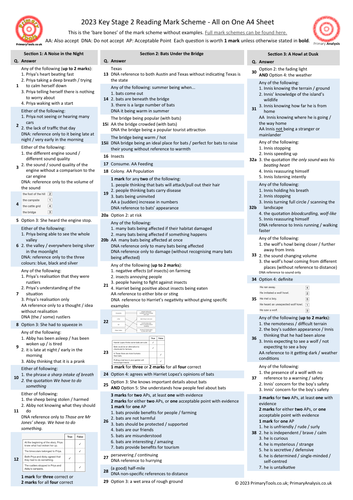
2023 KS2 SATs Reading Test Mark Scheme on a Page
(0)
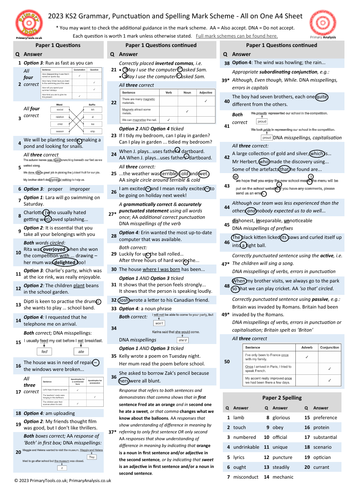
primaryclass
2023 KS2 SATs Grammar, Punctuation and Spelling Test Mark Scheme on a Page
(0)
primaryclass
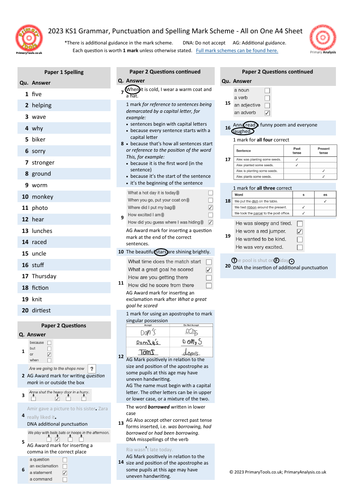
2023 KS1 SATs Grammar, Punctuation and Spelling Test Mark Scheme on a Page
(0)
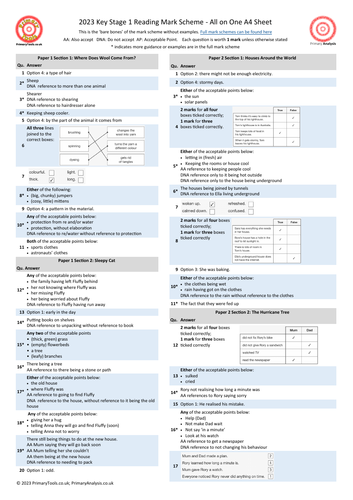
primaryclass
2023 KS1 SATs Reading Test Mark Scheme on a Page
(0)
primaryclass
2022 KS2 Reading Test and Question Level Analysis
(0)
primaryclass
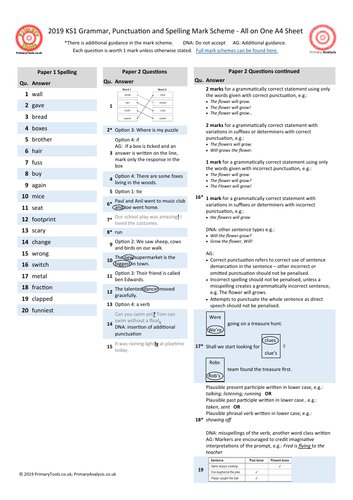
KS1 and KS2 2019 Grammar Punctuation and Spelling Mark Scheme on a Page
(0)
Previous
1
2
3
...
6
Next