 Quick View
IT Data Processing
This presentation resource on data processing for the A Level Cambridge course is designed to provide comprehensive lessons and engaging activities for students. It covers key concepts such as data collection, organization, analysis, and interpretation. The resource includes interactive exercises, real-world examples, and practical tasks to enhance students’ understanding and application of data processing techniques. It aims to equip students with the skills needed to handle data effectively and prepare them for their assessments.
Data processing in geography fieldwork
This lesson looks at how to process the data that you have collected in the field. It looks at which process is best and why.
 Quick View
Data processing systems worksheet.
A data processing systems worksheet is a document or form used to organize and analyze data within a computer-based system. It serves as a structured framework for recording, manipulating, and interpreting data, allowing for efficient data management and analysis.
The worksheet typically consists of rows and columns, forming a grid-like structure. Each column represents a specific data field or attribute, while each row represents a separate data entry or record. The cells within the worksheet can be populated with numerical values, text, dates, or other relevant data types.
In summary, a data processing systems worksheet is a powerful tool for organizing, manipulating, and analyzing data within a computer-based system.
It simplifies data management tasks, enables efficient data processing, and supports decision-making processes by providing a structured and user-friendly interface for working with data.
 Quick View
KS3 Data Representation Scheme of Work
A complete KS3 scheme of work, including how computers process and store binary, conversion to denary, binary addition, bitmaps, vector graphics, and sound.
Full of activities, discussions, and games especially written for years 7 to 9, and with all answers provided, this is an ideal introduction to key concepts to prepare and inspire your students for Key Stage 4.
Lesson 1: Binary to denary conversion + worksheet
Lesson 2: Denary to binary conversion + worksheet
Lesson 3: Binary addition and terminology + worksheet
Lesson 4: Character sets + worksheet
Lesson 5: Bits and pixels (bitmap and vector graphics) + worksheet
Lesson 6: Bits and sounds + worksheet
A fun scheme of work for students, easy-to-deliver for teachers. My students thoroughly enjoyed it, I’m sure yours will too.
Download today.
Clumsy Clive Geometry and Data Bundle
These are all available for free individually but if you don’t have the time then this is for you. Clive makes common mistakes, mistakes you’ll have seen in class. Your students need to find the mistakes, correct them and explain where Clive has gone wrong so that he doesn’t do the same thing again. These activities are designed to create discussion in class and can be used to assess understanding.
undefined
Monkey Data Project
THe excel file contains information on 500 monkeys from a fictitious newly discovered species.
Pupils task is to come up with a hypothesis and test it. Does monkeys favourite fruit change as they age? Is the length of a monkeys tail related to it's height or its gender? What is the main factor in how many offspring a monkey will have?
The data here is not completely random and there are connections and correlations to be discovered, some of them quite unusual. Great for budding Zoologists or pupils preparing for GCSE stats coursework.
Respirometer - Method, Data Processing and Evaluation
Includes opportunities to discuss experimental design, results and evaluation of limitations
Data processing in a geography fieldwork enquiry
This lesson looks at how to analyse data from a geography fieldwork that you have collected. It looks at different ways in which you can understand what is being produced.
Measures of Central Tendency and Data Processing
AS Geography presentation to explain basic measures and data processing techniques with accompanying ppqs and mark scheme answers.
Topic 11 : Measurement and data processing (IB)
Chemistry IB _ Grade 11 and 12
Topic 11 : Measurement and data processing
Paper Airplane Project: Rounding, Estimating and Data Processing
This presentation (including embedded hyperlinks and worksheets) is a multi-week project where students will apply their knowledge of rounding and estimating numbers and then processing that data via various graphing methods. My students had a lot of fun with this and were always eager for the next session. I hope yours feel the same!
Promethean/ActivInspire software is required for this file.
Making data suitable for processing
A lesson educating students on validation and verification, collecting data and big data
including objectives and keywords.
including exam questions
Suitable for the BTEC TA in DIT Component 2 Learning Aim A
Secondary data for enquiry processes
Secondary data lesson for the New AQA Activate 2 enquiry processes
 Quick View
Data Science - The Analysis Process
Free lesson resources for teaching Data Science NPA (National Progress Award) Levels 4,5 and 6.
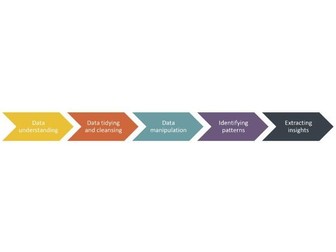
This lesson covers what is involved in the analysis process, specifically,
• what we mean by analysis
• a structured way of performing analysis (the analysis steps)
• how to understand data through visual inspection
Lesson content,
A PowerPoint/PDF presentation, ‘The analysis process’
Excel Question workbook on ‘The analysis process’ (for learners)
Excel Answers workbook on ‘The analysis process’ (for teachers)
Planning document with learning intentions and success criteria
For more information on the Data Science NPA, please see teachdata.science
This lesson has been created by effini in partnership with Data Education in Schools, The Data Lab and Data Skills for Work, with funding from the Scottish Government.
© 2021. This work is licensed under a CC BY-NC-SA 4.0 license.
 Quick View
Data Handling - Types of Data
Resources include a relevant starter, an explanation of the difference between qualitative, quantitative, discrete and continuous data and a card sort activity.
 Quick View
9626 Information Technology: Data processing and information Questions
9626 Information Technology: Data processing and information Questions
Collecting and interpreting data on favourite biscuit - Year 3
This is a worksheet where the chn have to discuss what the tally chart is about. LO and SC are included on the worksheet. Then the chn have to write the headings above the columns on the chart. Next the chn have to collect the data themselves, asking their peers which biscuit is their favourite and record it in tallies on the chart. Chn have to complete the chart and then discuss what they have found.
Finally I asked the chn to draw a bar graph and then analyse the data in their books.
 Quick View
Data Processing Methods - IT Computer Science - A Level
IT Essentials – Computer Processing Types – A Level
Breakdown of Batch, Online and Real processing with pros and cons of each. Comprehension questions. Mix and Match processing features activity. Google quiz for plenary. 3 Revision Flash Cards.
Ideal for IT and Computer Science. Designed for use be expert and non-expert teachers alike.
Wolsey Academy, a non-profit resource provider, directs all profits to various charities, including refugee support, youth sports, educational programs, and carbon capture, achieving a carbon-negative status. Explore our site for resources and free history role-playing games loved by students. Thank you for your dedication to teaching and for supporting our mission.
Resistivity Experiment - Processing data and Uncertainties
Process Raw data to find Resistivity of Nichrome.
Process absolute error on raw data to find uncertainties
Process gradients by linearizing the equation
Process uncertainty on gradient to give percentage uncertainty on final calculated value of Resistivity of Nichrome.
With answers. AQA Advanced Physics Style of processing uncertainties.
Data processing for NCEA PHY 3-1
Course notes and exercises to help with NCEA Level 3 Practical Investigations.
Dealing with uncertainty and error processing.
Graphing in Excel to included error lines and uncertainty
I will eventually re-home the other 3-1 graphing exercises to this site
pptx files will need to be downloaded and opened in Excel to retain formatting . . . Looks really messy and doesn’t work in Sheets!!