 Quick View
Human population growth
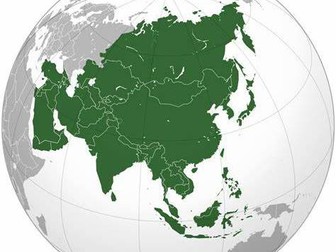
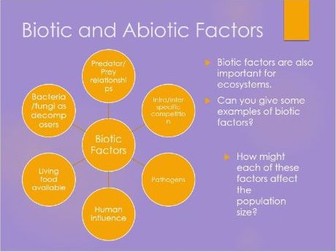
Human population growth is a comprehensive lesson designed to help GCSE students develop their understanding of the importance of biodiversity and the effects of human population growth through engaging activities and differentiated instruction.
This lesson is the 1st in a series of lessons and covers the content from the AQA 4.7.3.1 Biodiversity, 4.7.3.2 Waste management and 4.7.3.3 Land use lessons (B7 Ecology unit), and AQA GCSE Biology OUP Scheme B18.1 The human population explosion lesson (B18 Biodiversity and ecosystems chapter).
All resources are included, making it easy to run the lesson straight away. All text is editable, so you can adjust the depth, pace, or challenge to suit your class and the time you have available.
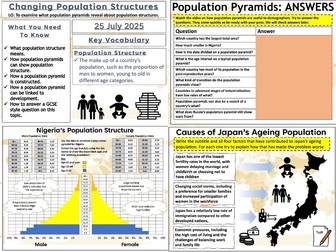
Presentation contains (32 slides)-
● Lesson Prep and Technician Notes: Guidance notes for teachers to prepare the lesson and technician instructions.
● Bell Work / Do Now Activity: Engaging task to activate student prior knowledge and set the stage for the lesson.
● Clear Lesson Aim, Objectives & Success Criteria: Explicitly defined learning targets to guide students and measure their understanding.
● Discussion Slides: Thought-provoking prompts and questions to introduce the topic.
● Information Slides with Levelled Content: Varied levels of information catering to diverse learning styles and abilities.
● Differentiated Activities (Group Work): Collaborative tasks in small groups to encourage active participation and enhance learning.
● Differentiated Questions with Answers: Comprehensive questions with accompanying solutions for self-assessment and note-taking.
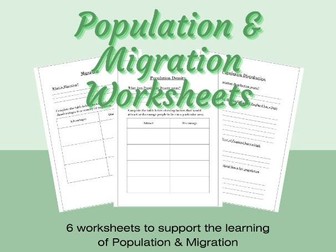
● Student Worksheets/Handouts: Printable materials for students to complete and gather notes.
Aimed at a mixed ability class covering content Grades 1-9, with three levels of demand to accommodate different learning styles and levels.
● Level 1: Low demand
● Level 2: Standard demand
● Level 3: High demand
This lesson is also available as a digital worksheet, which is ideal for absent students to catch-up missed work, distance learning, home schooling, or independent study.
Human population growth Distance learning
If you require more assistance, please contact me at-
info@cmgsciencelessons.com