Secondary maths collection
Welcome secondary maths teachers! Are you looking for quality assured resources, designed to make lesson planning easier? Spanning across multiple topics and key stages, this extensive collection, hand-picked by members of the Tes maths panel, is the perfect starting point...
Hand-picked by:


Interpreting and comparing averages and range
Lesson presentations and activities
Olympics themed lesson on comparing data using the range and an average. Powerpoint, task cards and answers included.
Reviews
Tillymaths19925 years ago
A lesson I come back to using time and time again. Many thanks for sharing
tr6rv6505 years ago
Many thanks for sharing
aumama5 years ago
Deciding what average to use? Comparing data using mean, mode, median and range. Powerpoint with accompanying worksheet (for pupils to discuss first) comparing English and Maths test scores. Uses stuff from BBC Bitesize website, plus an exam question on marathon times for plenary. Pretty straight forward.
Reviews
craigstephena year ago
Great help thanks
airun346 years ago
cplant16 years ago


Practice questions, homeworks and assessments
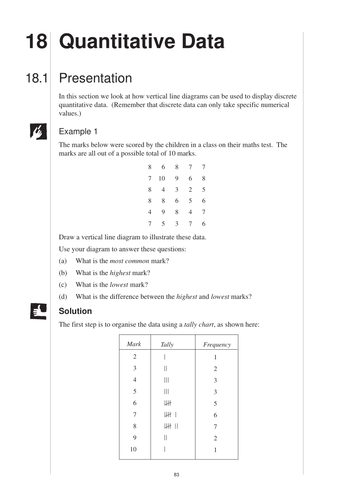
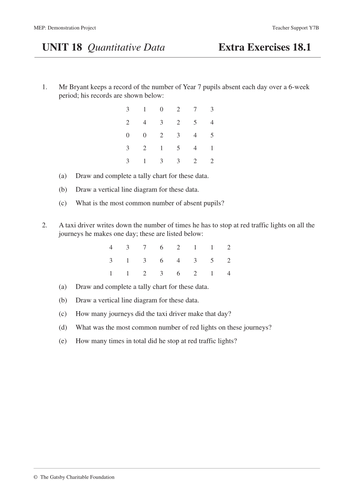
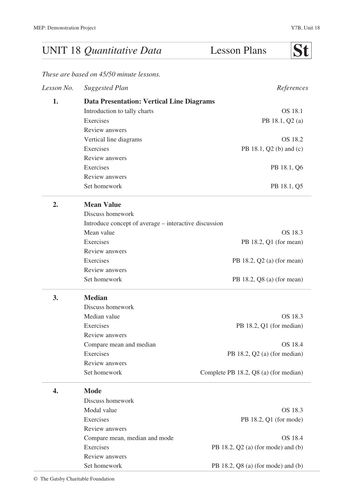
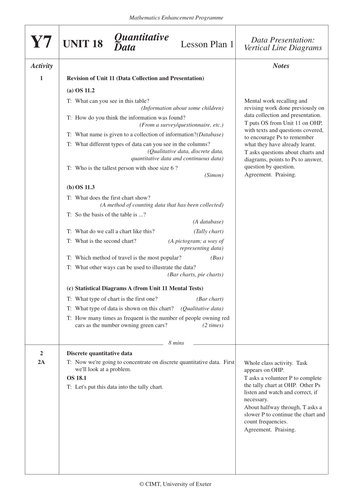
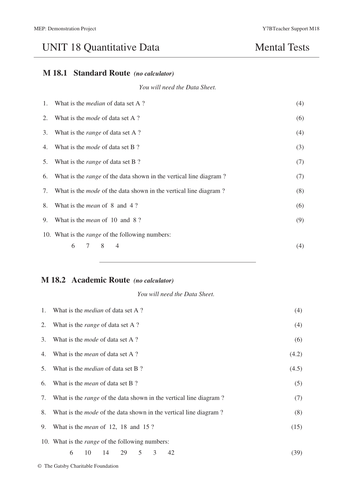
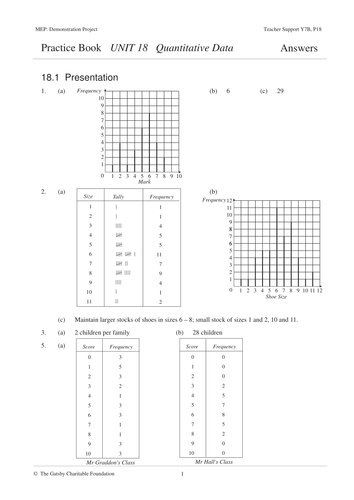
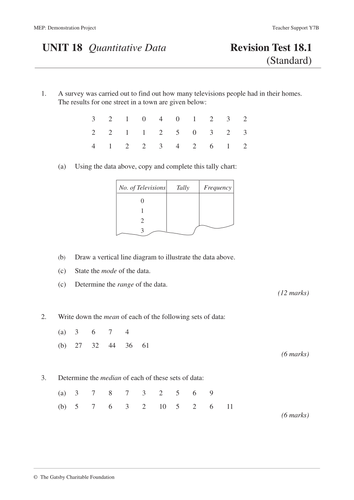
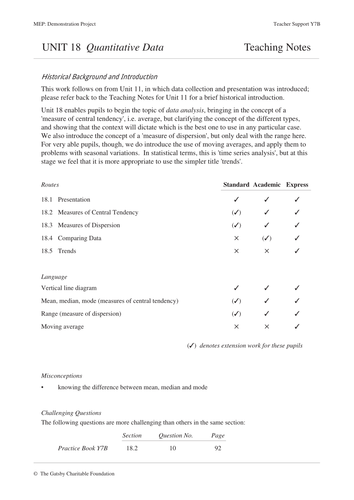
KS3 Maths worksheets and activities. The topic of Quantitative Data from the Year 7 book of the Mathematics Enhancement Program. For information about these resources and an index for the whole collection please visit http://www.mrbartonmaths.com/CIMT.htm Planning and Collecting Data, Interpreting results and comparing data. Keywords: Average, Mean, Median, Mode, Spread, Range, Dispersion, Moving Average, Central Tendency.
Reviews
knjadav7 years ago
Thank you for sharing the excellent resource.
lj_n7 years ago
Excellent resource thank you very much
rachaelosborne7 years ago
Very useful differentiated resources with activities, and additional exercises for consolidation.
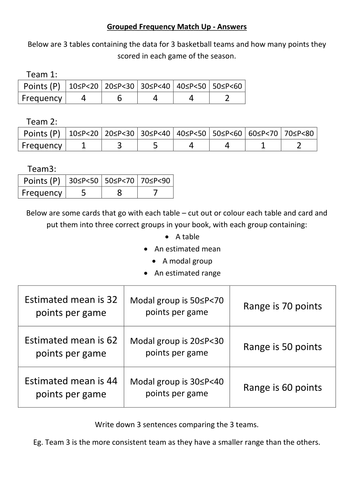
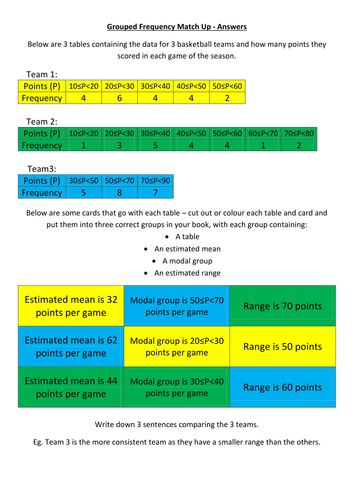
Either cut out and group or colour in the cards and tables that go together - just thought it would make a bit of a change to just grinding out questions.
Reviews
Beccasaj4 years ago
This looks great! Something a bit different that my lower-ability classes will hopefully find engaging.
inara1410 years ago
This is great - thankyou for your effort! It will be nice to have a switch up and it is great to have the extension at the end.
numberwhizz10 years ago
Thanks!
Dodgy Data lets students practice their skills at calculating averages . Students also need to say which average is best for a set of data. Students will engage better with the averages and therefore embed learning learning.
Included is differentiated worksheet, support sheet and teacher notes.Reviews
dan9999999 years ago
pikaprince9 years ago
A great selection of questions. All questions are linked to school in some way to engage students. Worksheets make the student have a deeper level of understanding.
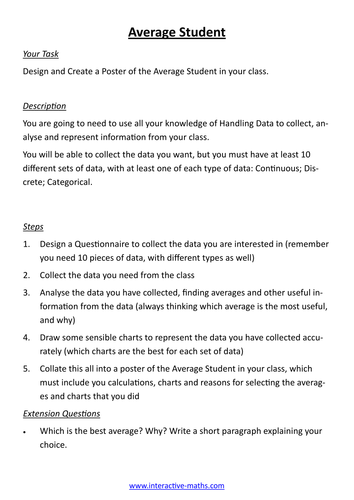
In this project, KS3/KS4 students follow the whole data handling cycle to create a poster of the 'Average Student' in their class. With detailed teachers' notes, and a project sheet to give out to your students, this project will challenge them to design a questionnaire, collect data, analyse and present their findings, whilst producing a wonderful display in the process. Comments appreciated.
Reviews
kooldude6 years ago
Very useful. Thank you for sharing.
Eman3476 years ago
Doing this in school very helpful thanks
rozeevans8 years ago
Just what I needed to give a focus to a year 9 data handling topic. Thank you.
Four questions about averages that pupils might find more interesting than the usual ones from the textbook.
Reviews
dinasantos7 years ago
caitharn8 years ago
rmaslen8 years ago