International
Resources
Topical and themed
Pre-K and Kindergarten
Elementary
Middle school
High school
Special education
Education Jobs
Schools directory
News
Courses
Store
Resources
Education Jobs
Schools directory
News
Search
Tes for schools
Log in
Register
for free
Resources
Education Jobs
Schools directory
News
Magazine
Courses
Log out
Help
Home feed
My list
Courses
My Jobs
Job alerts
My CV
Career preferences
Resources
Author dashboard
Settings
Edit account
Log out
Home
Resources
Jobs
Schools directory
News
Magazine
Courses
Register for free
Log in
Help
The Primary Collection
Add a resource
Edit shop
Average Rating
4.27
(based on 1078 reviews)
The Primary Collection
Average Rating
4.27
(based on 1078 reviews)
Edit shop
Add a resource
254
Uploads
2166k+
Views
2099k+
Downloads
All resources
Whole school
English
Mathematics
Languages
Primary science
Pedagogy and professional development
Citizenship
Personal, social and health education
Physical education
Government and politics
History
Literacy for early years
New teachers
Physical development
Special educational needs
More
Mathematics
Relevance
Relevance
Newest
Highest rated
Lowest price
primaryclass
2025 KS2 SATs Mathematics Test Mark Scheme on a Page
(0)
primaryclass
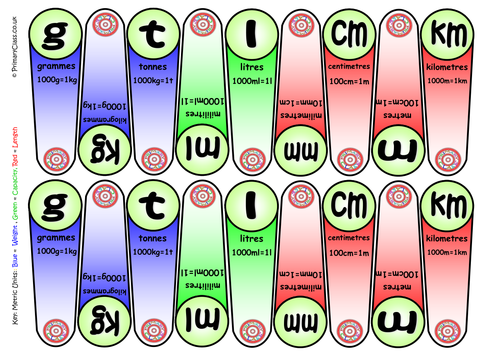
Metric Units of Measurement Fan
(13)
primaryclass
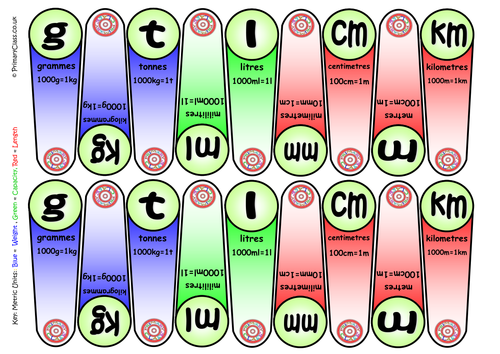
Measurement Fans
(0)
primaryclass
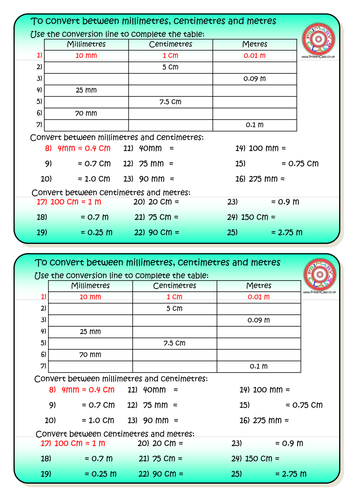
mm cm and m Length Conversion Worksheet
(24)
primaryclass
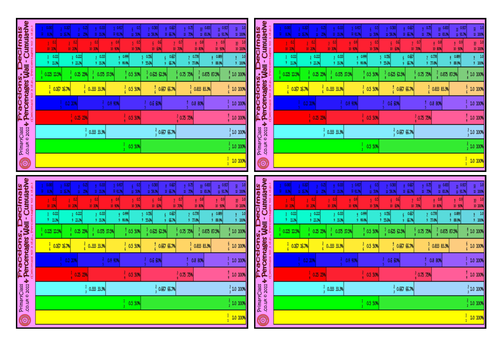
Fraction Decimal and Percentage Wall -Teaching Aid
(5)
Bundle
primaryclass
Rapid Series Bundle
6 Resources
primaryclass
2025 KS1 SATs Mathematics Test Mark Scheme on a Page
(0)
primaryclass
2024 KS2 SATs Mathematics Test and Question Level Analysis
(0)
primaryclass
2024 KS1 Mathematics Question Level Analysis
(0)
primaryclass
Rapid Arithmetic - 48 Rapid Arithmetic Activities for Upper Key Stage 2
(0)
primaryclass
2016 KS2 Mathematics Test Electronic Analysis
(0)
primaryclass
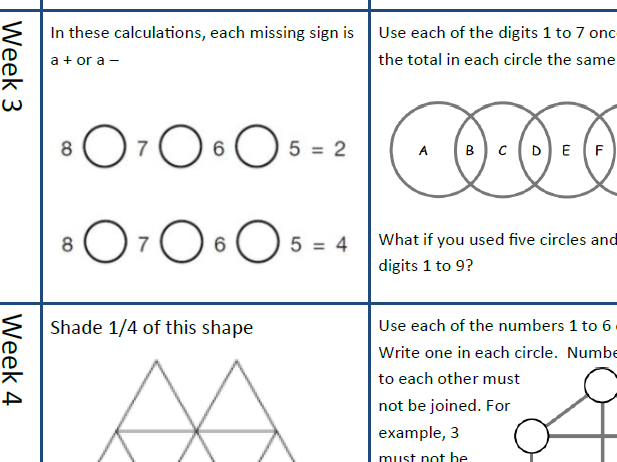
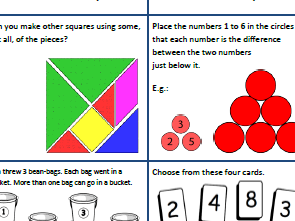
Year 5 and 6 Mathematics Challenges for every day of the Summer Holidays
(0)
primaryclass
Year 3 and 4 Mathematics Challenges for every day of the Summer Holidays
(0)
Bundle
primaryclass
Mathematics Challenges for every day of the Summer Holidays
3 Resources
primaryclass
Year 1 and 2 Mathematics Challenges for every day of the Summer Holidays
(0)
primaryclass
Rapid Arithmetic for Lower Key Stage 2
(0)
Bundle
primaryclass
2018 KS1 Test and Writing Analysis Bundle
4 Resources
primaryclass
2018 KS1 National Curriculum (SATs) Test Analysis for Mathematics
(0)
primaryclass
2022 KS2 Mathematics Test and Question Level Analysis
(0)
primaryclass
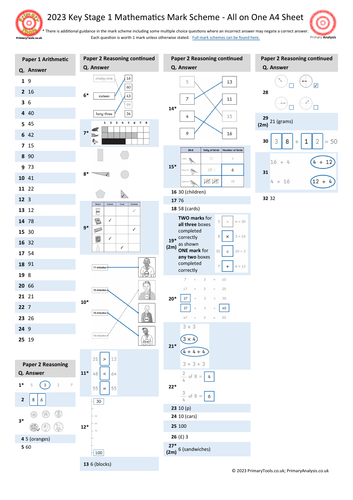
2023 KS1 SATs Mathematics Test Mark Scheme on a Page
(0)
Previous
1
2
3
Next