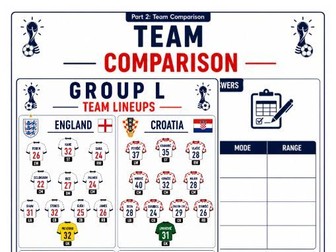
A ready-to-use World Cup 2026 maths activity using team line-ups and player age data.
Includes:
REAL Visual team line-up sheets
REAL Player age data
Mean, median, mode and range questions
Team comparison activities
Football-themed reasoning challenges
Perfect for KS2, lower KS3, statistics lessons and end-of-term maths
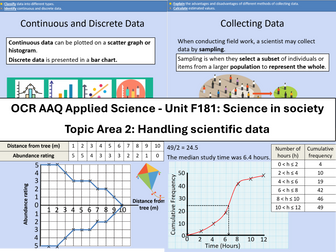
Course: OCR Level 3 Alternative Academic Qualification Cambridge Advanced Nationals in Applied Science.
Unit F181: Science in society
Topic Area 2: Handling scientific data
2.1 Types of scientific data
2.2 Collecting scientific data
2.3 Storage and presentation of scientific data
2.4 Interpreting data
Qualitative and quantitative data
Continuous and discrete data
Data from observations and
measurements
Primary and secondary data
Observation and measurement
from experiments
Surveys
Sampling
Random
Systematic
Estimation
Cohort studies
Meta-studies
Computer modelling
Personal database
National database
International database
Scatter and line graph
Bar chart
Histogram
Pie chart
Kite diagram
Cumulative graph
Box and whisker plots
Draw conclusions
Accept or reject a hypothesis
Inform further scientific
investigation
Mathematical skills include:
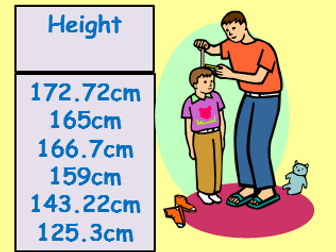
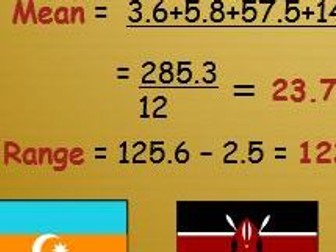
Calculate the mean, median, mode, range (e.g. height of group of organisms, number of stomata in a plant).
Determining the intercept and/or gradient using y = mx + c.
Calculating the rate of change from a graph with a linear relationship (e.g. rate of transpiration).
Drawing a tangent to a curve on a graph to calculate the rate of change (e.g. amount of product produced against time, at a fixed concentration of enzyme).
Calculate the standard deviation of a set of data.
Resources include a relevant starter, an explanation of the difference between qualitative, quantitative, discrete and continuous data and a card sort activity.
Harness World Cup 2026 Fever for Maximum Classroom Engagement!
Keep your students focused and motivated during the end-of-term excitement! Maths in Motion: World Cup 2026 Data-Handling & Numeracy Workbook channels enthusiasm for the world’s biggest sporting event into concrete, high-impact math skills.
Using real 48-team tournament data, geographic time zones, and historical statistics, this zero-prep, print-and-go resource brings abstract concepts to life.
Resource Highlights
Target Levels: Primary (KS2) & Lower Secondary (KS3)
Curriculum Focus: Statistics, Geometry, Position, Ratio, and Probability
Setup Time: Zero Prep – Print and Deploy
What’s Included in the Workbook?
This comprehensive pack features 4 progressive, tiered tasks complete with dedicated marks for easy assessment:
Task 1: Plotting the Host Stadium Grid – Grid reading, coordinate plotting, and vector shifts using North American host cities.
Task 2: Historical Tournament Stat Analyses – Calculating the Mean, Median, Mode, and Range of real FIFA scoring data, plus a 2026 expansion predictive challenge.
Task 3: Time-Zone Matrix Calculations – Functional numeracy and multi-step time-difference problem solving (GMT vs. US/Mexico time zones).
Task 4: Bracket Probability & Logic Models – Fraction, decimal, and percentage practice using tournament progress trees and stadium attendance ratios.
Built-In Differentiation
Every task contains tiered tracks clearly marked by difficulty, making it perfect for mixed-ability classrooms:
Core Level (KS2 / Lower Track): Basic coordinates, standard averages, positive time differences, and simple fraction probabilities.
Extended Level (KS3 / Higher Track): Vectors, negative integer timelines, and compound probability reasoning.
Save hours of planning and deliver a high-interest, curriculum-aligned math lesson. Download the Maths_in_Motion_World_Cup_Worksheets.pdf pack today!
This is a resource I have used all week for a middle ability year 4/5/6 class. Covering pictograms, caroll diagrams, bar chars, line graphs and venn diagrams.
A collection of worksheets and activities in a range of styles. Some activities are pair work/ lead to class discussion. Includes a wordseach. Also a handling data Project - which is the fittest form.
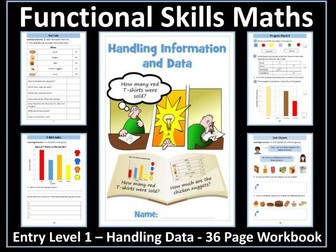
This resource has been designed for students working towards Functional Skills Maths qualifications at Entry Level 1 (Edexcel-Pearson, NCFE, City and Guilds, AQA, Highfield Qualifications, NOCN, Open Awards). It contains an age-appropriate, 36-page workbook on handling information and data.
This resource will help pupils to achieve these outcomes:
read numerical information from lists
sort and classify objects using a single criterion
read and draw simple charts and diagrams including a tally chart, block
diagram/graph
The 35-page workbook contains 10 information pages, 24 worksheets, 2 progress checks and a certificate of achievement. It is available in PDF and an editable PowerPoint version. It can be used for classwork, homework, revision or as an independent learning pack.
Please note, the watermark on the preview images is not present on the resource itself.
You may also be interested in:
Entry Level 1 - Handling Data - 100+ Slide PowerPoint Lesson
The editable PowerPoint lesson explains how to extract information from lists,
sort and classify objects, read and draw simple charts and diagrams including a tally chart and block graph. It provides many opportunities for pupils to apply this knowledge and practise their data handling skills. It also contains several links to videos on data handling and example exam questions. It is ideal for introducing this component of the specification and for revision purposes.
Save money and buy both resources at a discounted rate:
Entry Level 1 - Handling Data - PowerPoint and Workbook
The bundles below contain workbooks and PowerPoint lessons that cover all of the outcomes pupils are required to achieve at each level.
Level 1 - Numbers and The Number System Bundle
Level 1 - Measures, Shape, Space Bundle
Level 1 - Handling Information and Data Bundle
Entry Level 3 Bundle
Entry Level 2 Bundle
Entry Level 1 Bundle
Level 1 Maths Resources
Entry Level English Resources
a good starter/ revision activity on analysing and processing numbers to work out fractions, decimails, ratio or % from whole numbers. it also covers probability (OR/ AND RULE) and other averages.
I will be suitable for L2/ GCSE students on F/H tiers. I have used it for my revision classes and it was a good resource.
This little PowerPoint introduces two skills from the Information Technology Skills Ladder.
I can use key words to describe and find objects IT-DH1
I can sort objects into different groups IT-DH2
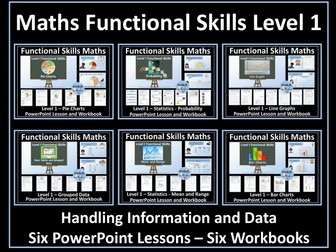
This resource has been designed for Entry Level 3 students working towards Functional Skills Maths qualifications at Level 1 (Edexcel-Pearson, NCFE, City and Guilds, AQA, Highfield Qualifications, NOCN, Open Awards). It contains 6 workbooks and 6 PowerPoint lessons on handling information and data.
These resources will help pupils to achieve these outcomes:
represent discrete data in tables, diagrams and charts including pie charts, bar charts and line graphs
group discrete data and represent grouped data graphically
find the mean and range of a set of quantities
understand probability on a scale from 0 (impossible) to 1 (certain) and use
probabilities to compare the likelihood of events
use equally likely outcomes to calculate the probability of a simple event and to express it as a fraction in its simplest form
The bundle includes six workbooks and six PowerPoint lessons:
Workbooks
The 25+ page workbooks contain explanation pages, worksheets,progress checks and certificates of achievement. They are provided in PDF and editable PowerPoint versions. They can be used for classwork, homework, revision or as an independent learning pack.
PowerPoint Lesson
The PowerPoint lessons clearly explain the skills and knowledge needed for the handling information and data component of the Level 1 specification. Many opportunities are provided within the PowerPoints for students to reinforce and consolidate their knowledge and to practise their skills in handling data.
All the PowerPoints contain video links to the various components of data handling and representation and to example exam questions. They are ideal for introducing the various components of the handling information and data specification and for revision purposes.
You may also be interested in:
Level 1 - Numbers and The Number System Bundle
Level 1 - Measures, Shape, Space Bundle
Level 1 - Handling Information and Data Bundle
Level 2 Functional Skills Maths Resources
Entry Level 3 Maths Bundle
Entry Level 2 maths Bundle
Entry Level 1 Maths Bundle
Entry Level English Resources
Posters for data handling working wall display. These posters cover all area of the information handling topic for KS2/2nd level, including line graphs, pictographs, bar charts, pie charts and explaining data handling.
The display is visual, and uses dyslexia-friendly fonts.
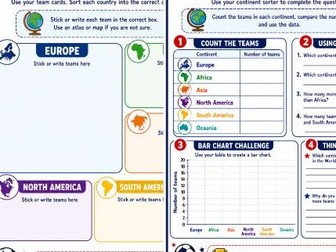
A geography and data-handling activity based on all 48 World Cup 2026 teams.
Includes:
Continent sorting activity
All 48 qualified teams
Data collection task
Bar chart challenge
Questions based on the completed data
Combines maths, geography and World Cup excitement
Perfect for KS2, lower KS3, statistics lessons and themed project work
This document is a revision booklet I put together for my students over the years. It contains worked examples and notes describing how certain problems are solved.
A mixed bundle of resources which can be used as starters/ homeworks and to make the handling data units in years 7/8 a little richer. Includes a suggested handling data project resources and probability worksheets.
This 9 page booklet is designed to help students and parents when with mathematical questions within their class and homework be it in Maths, Science, Geography, etc.. Topics Include:
Tables
Bar Graphs
Line Graphs
Scatter Graphs
Pie Charts
Averages
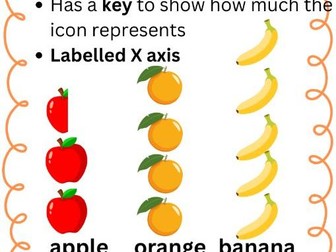
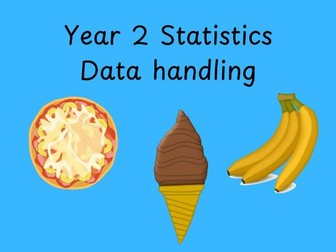
This resource includes tally charts to be completed, making pictograms and interpreting data from pictograms and tables, involving counting in 1, 2s, 5s and 10s. These activities will supplement maths schemes and focus on the objectives of the year 2 maths curriculum - statistics.
 Quick View