


A complete lesson on reading data and graphs for US high school biology, grades 9-12, built around Thomas Malthus’s 1798 warning about population and food.
Students read how world population grew from one billion around 1804 past eight billion in 2022, and why Malthus’s prediction did not play out. Along the way they learn to check a graph’s axes and units, describe a trend, choose between a line graph and a bar graph, and tell correlation from causation.
The figure is a line graph of world population, in billions, every 50 years from 1800 to 2000, drawn from published United Nations estimates. Vocabulary: axis, trend, correlation, causation and confounding variable.
Start with First Look, which asks whether carrying a phone causes car accidents. Teach with the slides and Field Notes, use the Field Study for the reading and graph work, and finish with Last Look. It works for a home educator teaching one student, too.
The download has 6 PDFs (13 pages) and one editable PowerPoint file.
NGSS: HS-LS2-2. Part of Fieldmark Biology’s Studying Life unit.
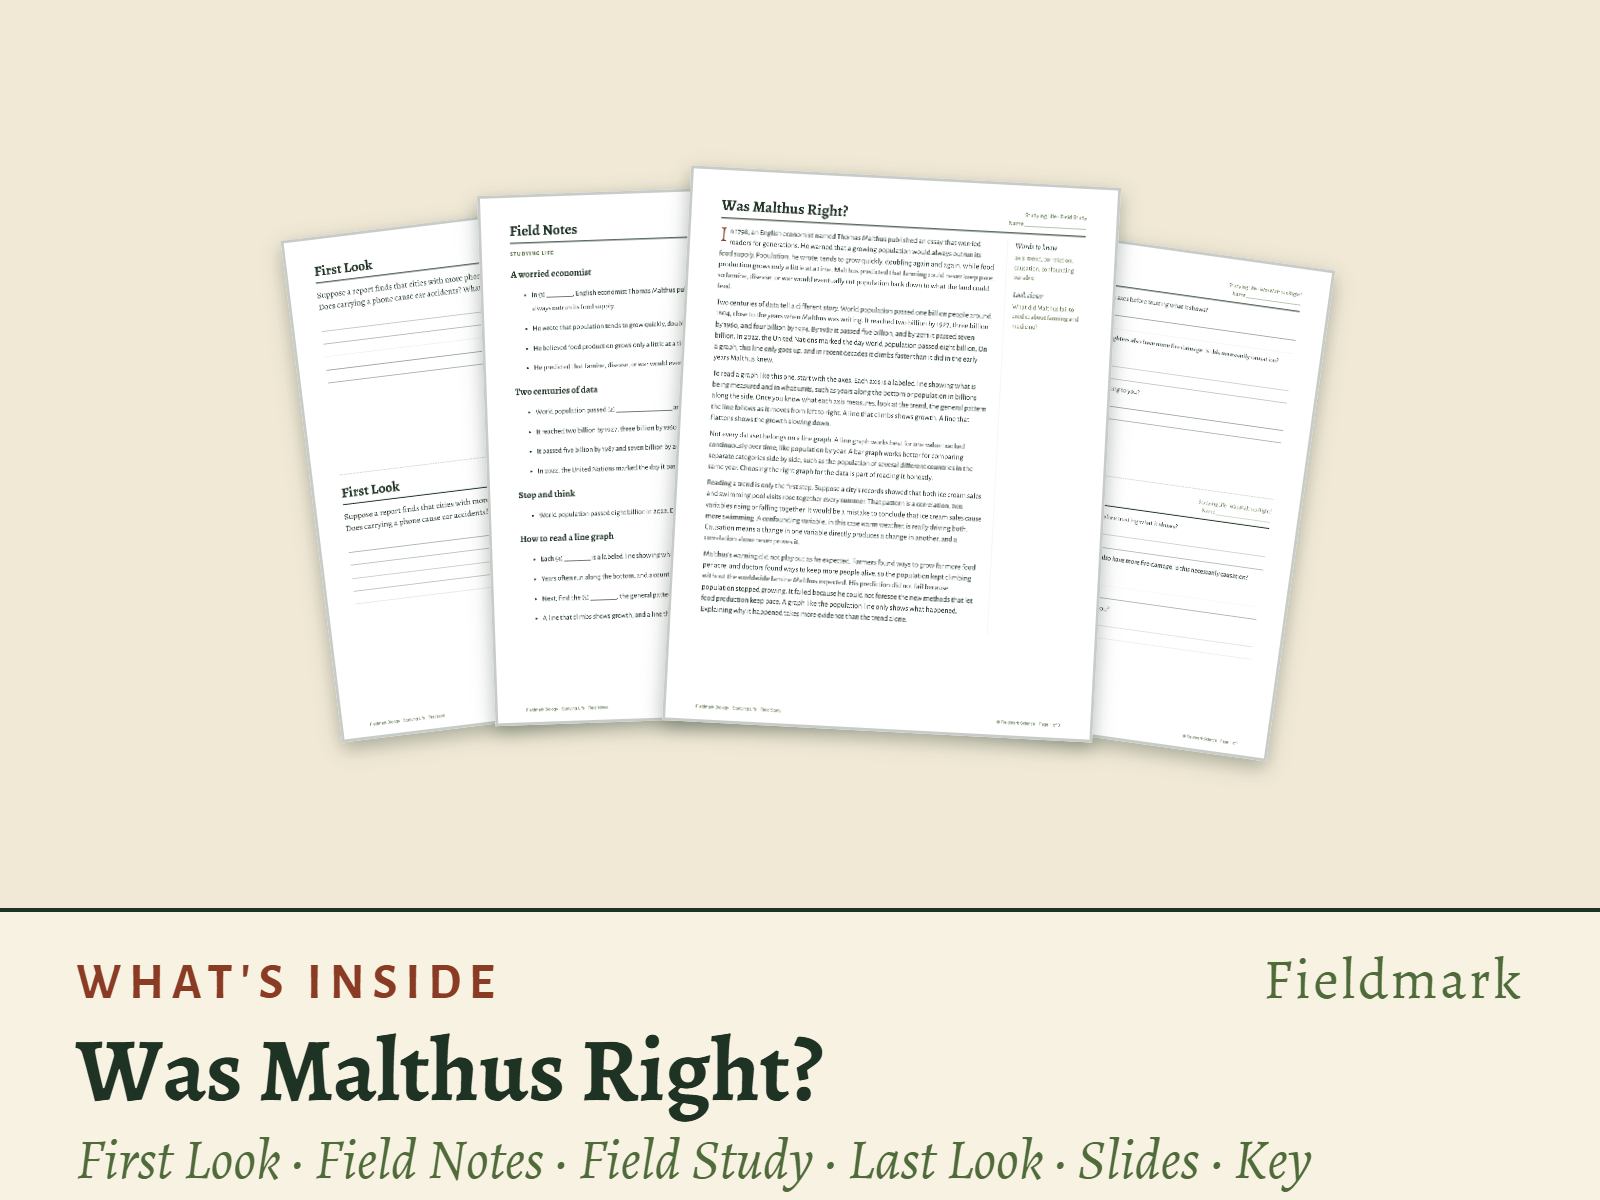
Included in the ZIP download:
- First Look (bell ringer): a one-page opening activity.
- Field Notes (guided notes): 3 pages of student notes to use with the slides.
- Field Study (reading and activity): a 3-page packet with the reading, comprehension questions, vocabulary and figure analysis.
- Last Look (exit ticket): a 1-page closing check.
- Teacher Key: 3 pages of answers plus the Lesson at a Glance plan.
- PowerPoint: 10 slides with speaker notes.
- Start Here: a 2-page introduction and terms of use.
Something went wrong, please try again later.
This resource hasn't been reviewed yet
To ensure quality for our reviews, only customers who have purchased this resource can review it
Report this resourceto let us know if it violates our terms and conditions.
Our customer service team will review your report and will be in touch.
$4.99